Fig. 9.
Download original image
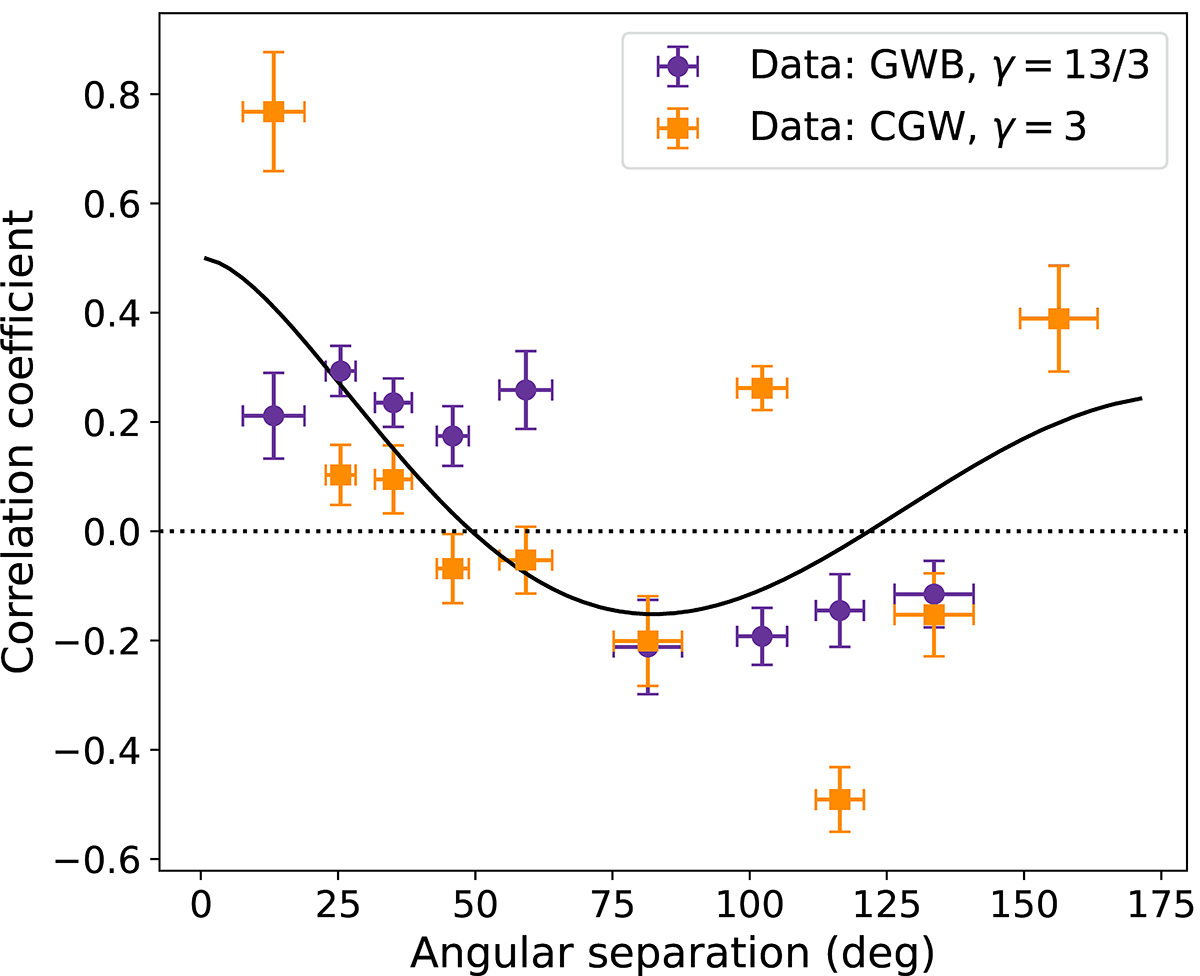
Overlap reduction function obtained with the optimal statistic. Purple circular and orange squared points indicate the results for the injGWB02 and injCGW5 datasets respectively. The correlation coefficients for each pair of pulsars are grouped in 10 bins of 30 pulsar pairs each, the points represent the weighted average in each bin. The solid line shows the expectation value of the HD correlation. Note that the purple rightmost point lie below the orange one.
Current usage metrics show cumulative count of Article Views (full-text article views including HTML views, PDF and ePub downloads, according to the available data) and Abstracts Views on Vision4Press platform.
Data correspond to usage on the plateform after 2015. The current usage metrics is available 48-96 hours after online publication and is updated daily on week days.
Initial download of the metrics may take a while.