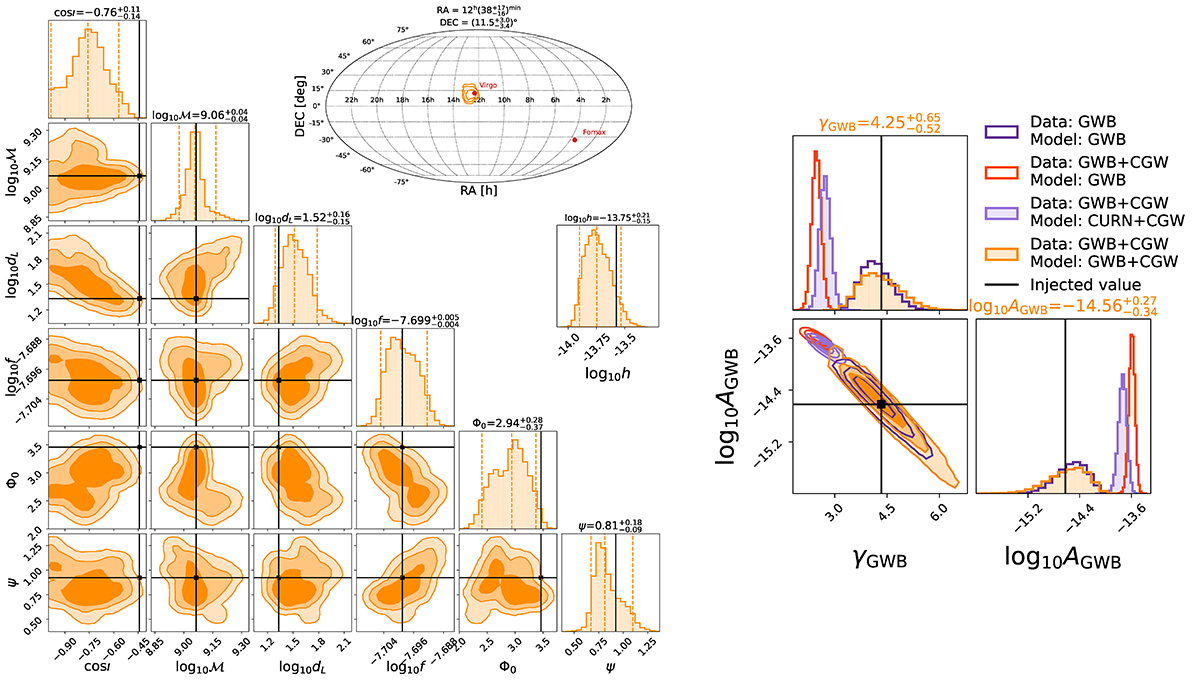
Fig. 14.
Download original image
Same as Fig. 13 but for dataset injGWB03+CGW5. The only difference is that in the right panel, we show the joing GWB + CGW analysis either modelling the GWB as a CURN and then using the re-weighting technique (filled purple) or by directly modelling the HD correlations in the GWB search (filled orange). All other distributions and markers have the same colour style and meaning as in Fig. 13.
Current usage metrics show cumulative count of Article Views (full-text article views including HTML views, PDF and ePub downloads, according to the available data) and Abstracts Views on Vision4Press platform.
Data correspond to usage on the plateform after 2015. The current usage metrics is available 48-96 hours after online publication and is updated daily on week days.
Initial download of the metrics may take a while.