Fig. 13.
Download original image
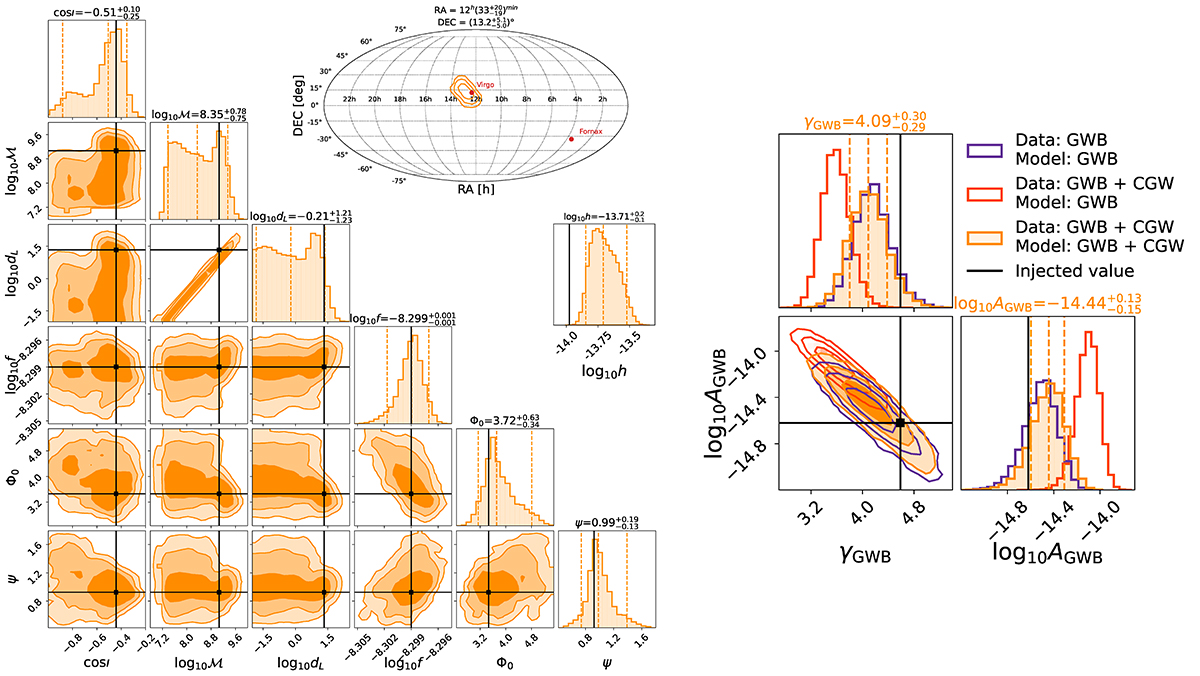
CGW (left) and GWB (right) recovered by the joint search applied on dataset injGWB03CGW5. Left panel: Posterior distributions of the CGW source parameter using the full ET + PT template. The panel is organized as the ones in Fig. 3, with 6 source parameters shown in the triangle plot, the sky localization error shown in the sky map and the recovered signal amplitude h shown in the stand-alone inset. Injected values are marked by the black solid lines. Right panel: Posterior distributions of the GWB parameters. The GWB recovery from the joint search on the injGWB03+CGW5 dataset is shown in orange. For comparison, the recovery of a GWB only search on the injGWB03CGW5 is shown in red while the recovery of a GWB only search on the GWB-only injGWB03 dataset is shown in purple. Solid black lines represent the injected values. In both panels we mark for each parameter the median and 68% credible interval of the recovery.
Current usage metrics show cumulative count of Article Views (full-text article views including HTML views, PDF and ePub downloads, according to the available data) and Abstracts Views on Vision4Press platform.
Data correspond to usage on the plateform after 2015. The current usage metrics is available 48-96 hours after online publication and is updated daily on week days.
Initial download of the metrics may take a while.