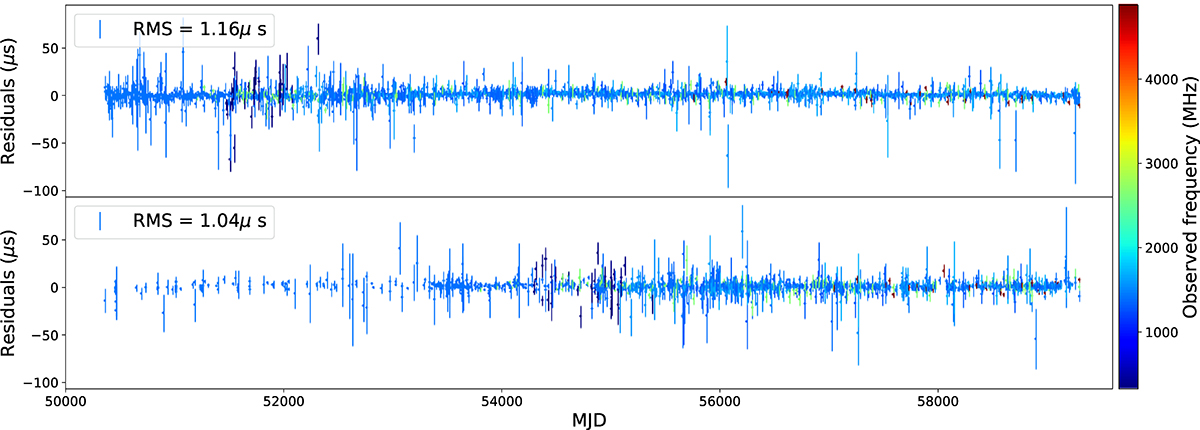
Fig. 1.
Download original image
Pulsar PSR J1022+1001. Top: Simulated data. Bottom: Real data from EPTA DR2full. The properties that are exactly reproduced are the time span, number of observations, frequency coverage, and the noise levels. The main difference between the two datasets is in the distribution of the ToAs; while in our simulations, ToAs are unevenly sampled, they are still uniformly distributed over the observational timespan, meaning that sparse observations and long gaps are absent (as can be clearly seen in a visual comparison of the two panels).
Current usage metrics show cumulative count of Article Views (full-text article views including HTML views, PDF and ePub downloads, according to the available data) and Abstracts Views on Vision4Press platform.
Data correspond to usage on the plateform after 2015. The current usage metrics is available 48-96 hours after online publication and is updated daily on week days.
Initial download of the metrics may take a while.