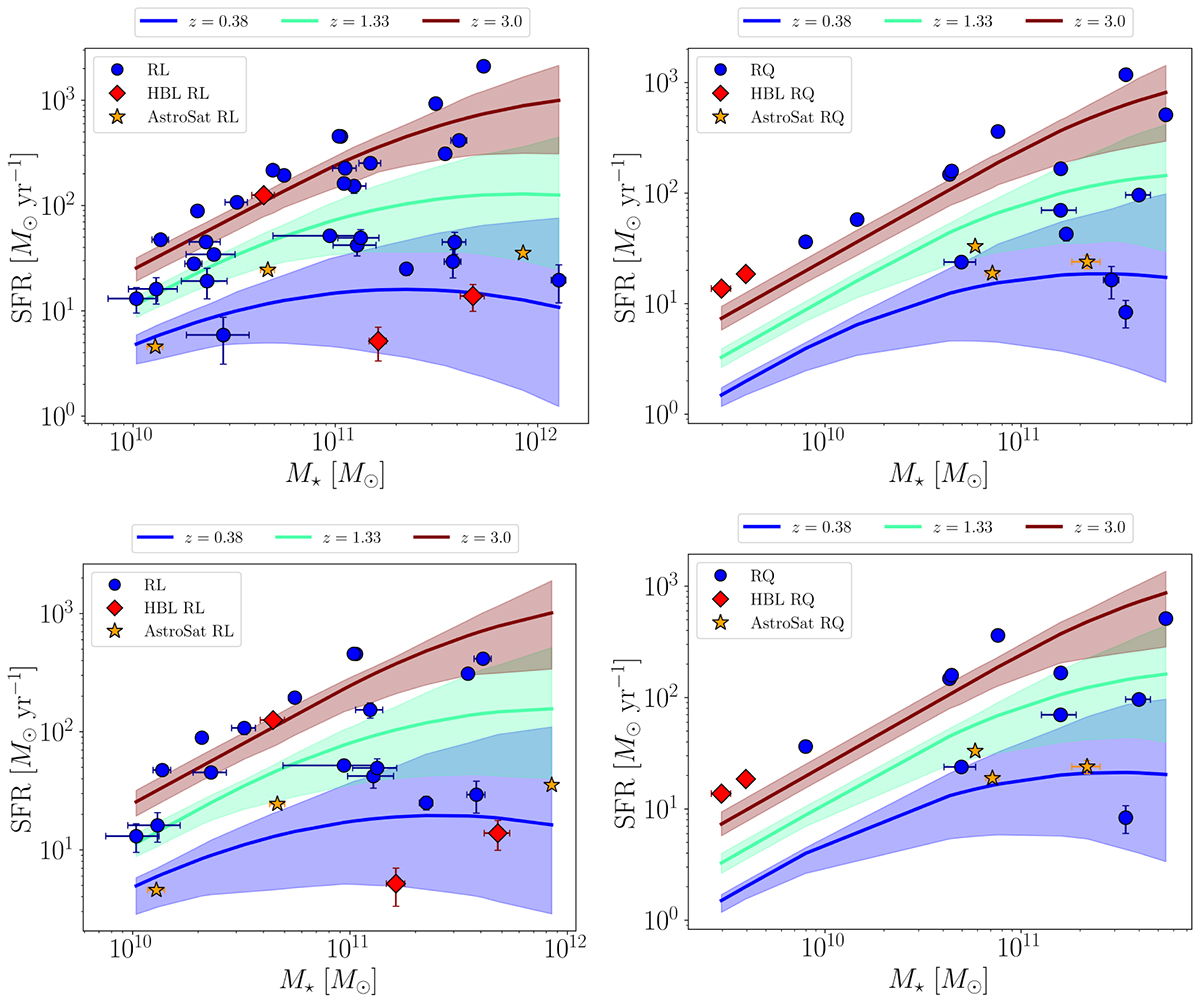
Fig. 8.
Download original image
Variation in stellar mass (M⋆) of the host galaxies with their corresponding SFRs. Overplotted solid lines are analytical galaxy MS relations from Schreiber et al. (2015), at different redshifts with corresponding 1-σ uncertainty contours. We note that the highest redshift of our sample is z ∼ 1.8 (see Fig. 1), and thus the z = 3 trend lies outside our sample’s redshift range. The majority of the sources in our sample lie at a significant distance from the galaxy MS and tend to follow the high-redshift (z = 3) trend. In Fig. 9, we have colour-coded our sources with redshifts. Top left panel: For entire RL non-HBL, HBL and AstroSat-observed sources. Top right panel: For entire RQ non-HBL, HBL and AstroSat-observed sources. Bottom left panel: For RL non-HBL, HBL and AstroSat-observed sources that follow the criteria of Mountrichas et al. (2021). Bottom left panel: For RQ non-HBL, HBL and AstroSat-observed sources that follow the criteria of Mountrichas et al. (2021). The observed bimodality in the MS for RL quasars is evident. See Fig. 10 and discussions in Sect. 4.
Current usage metrics show cumulative count of Article Views (full-text article views including HTML views, PDF and ePub downloads, according to the available data) and Abstracts Views on Vision4Press platform.
Data correspond to usage on the plateform after 2015. The current usage metrics is available 48-96 hours after online publication and is updated daily on week days.
Initial download of the metrics may take a while.