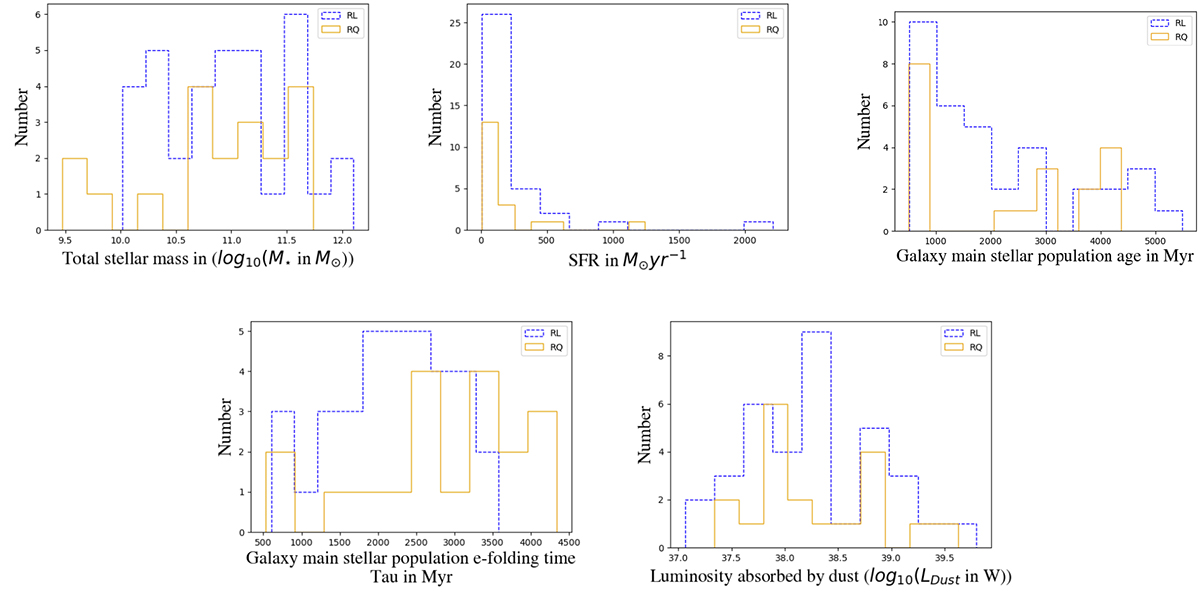
Fig. 7.
Download original image
Distributions of host galaxy properties. Top left panel: Solid orange and dashed blue lines denote the histograms of stellar mass (M⋆) for the host galaxies of RQ and RL quasars of the non-HBL+HBL+AstroSat-observed samples. Top middle panel: Same as the top left panel but for the SFR distributions. Top left panel: Same as the top left panel but for the stellar population age distributions. Bottom left panel: Same as the top left panel but for the e-folding time distributions. Bottom right panel: Same as the top left panel but for the dust luminosity distributions. The mean values of the parameters for our RL and RQ sources are provided in Table 3.
Current usage metrics show cumulative count of Article Views (full-text article views including HTML views, PDF and ePub downloads, according to the available data) and Abstracts Views on Vision4Press platform.
Data correspond to usage on the plateform after 2015. The current usage metrics is available 48-96 hours after online publication and is updated daily on week days.
Initial download of the metrics may take a while.