Fig. C.2.
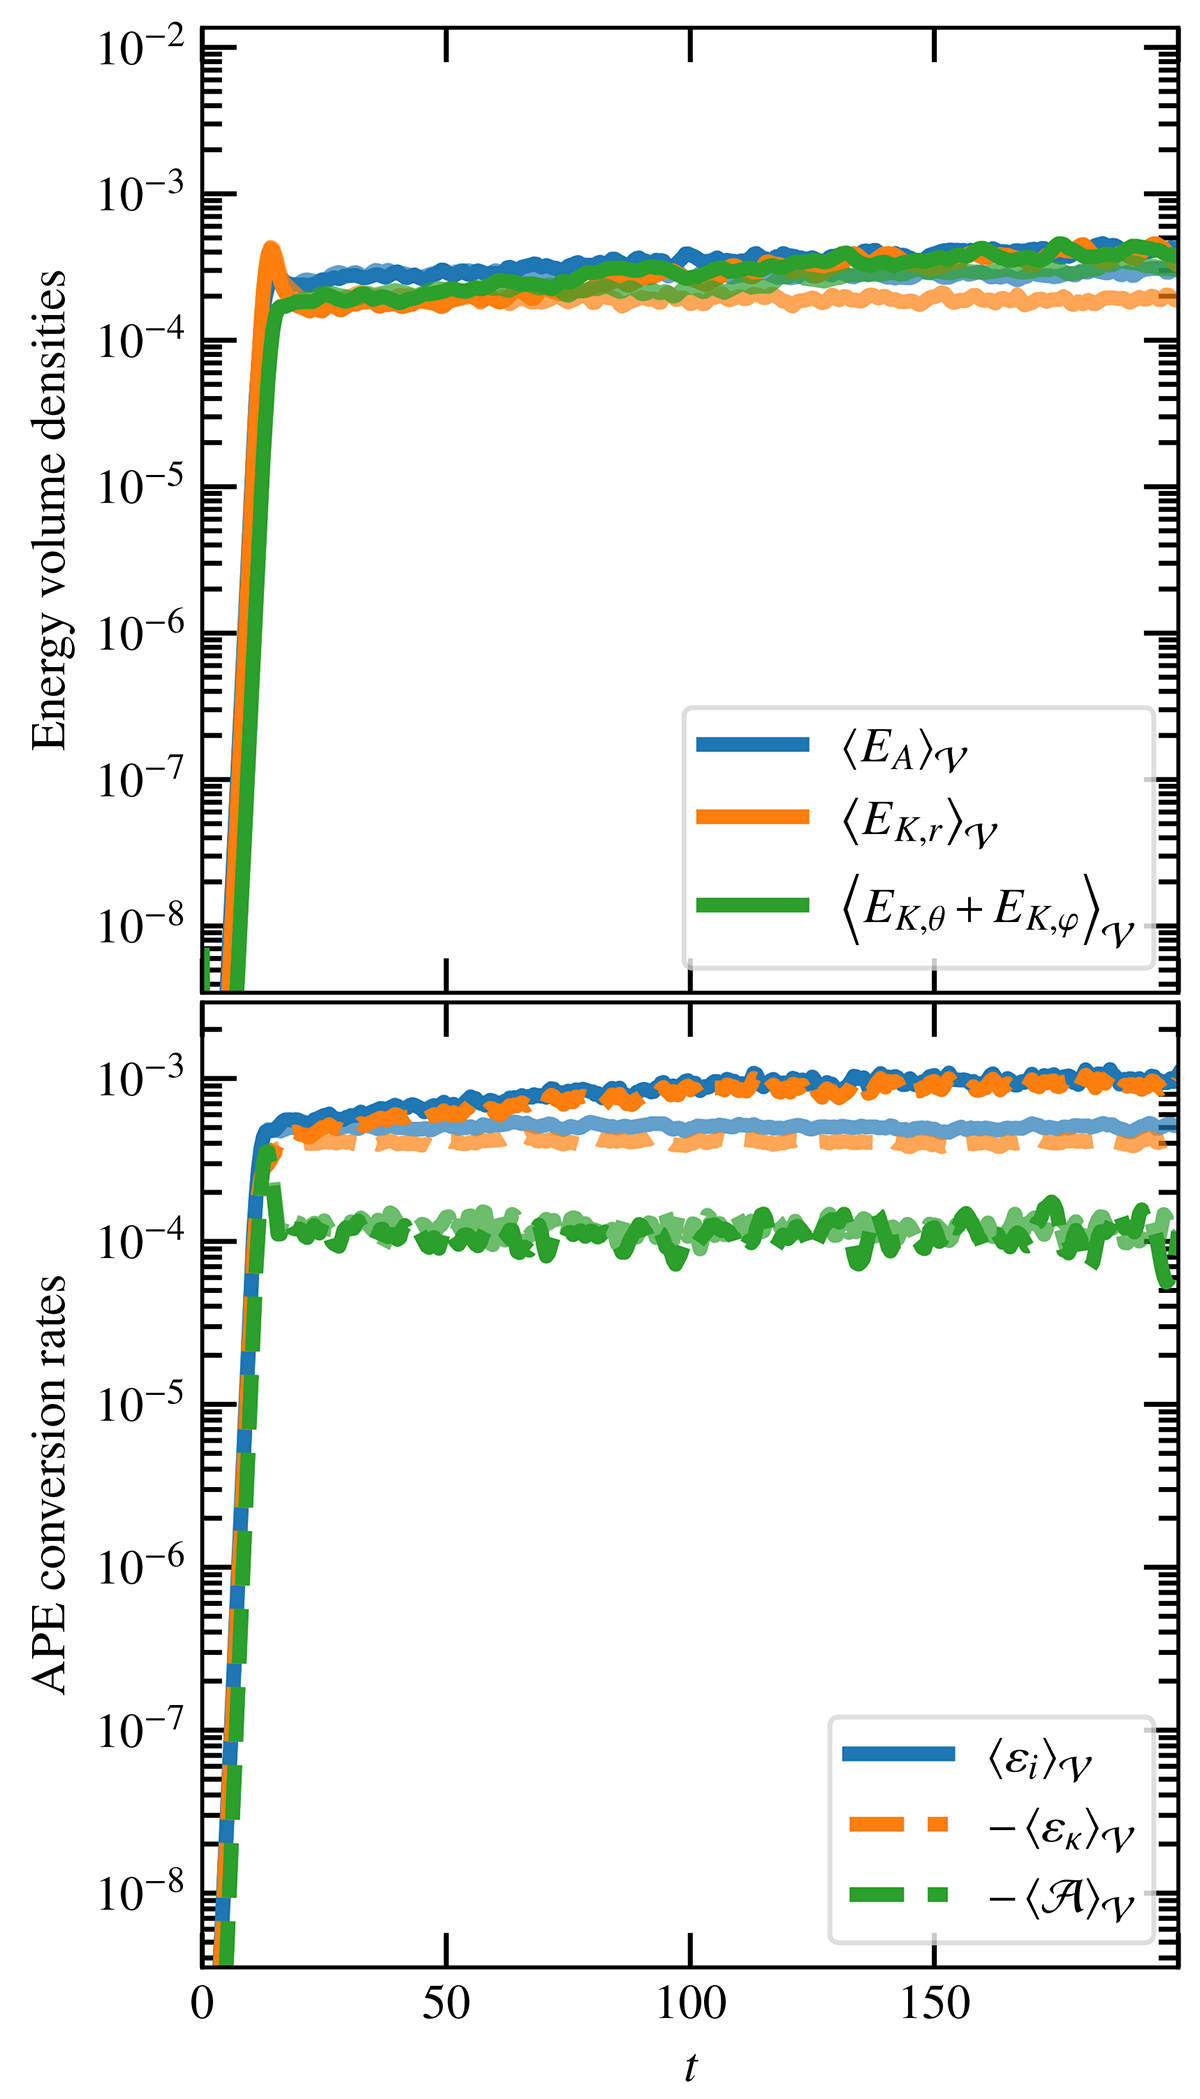
Download original image
Comparison of the saturation regimes in the simulation with the local HSE BC of Zingale et al. (2002) (opaque lines) and in the 2dDf1e–2 run with the BCs described in Sect. 3.3 (transparent lines). Top: Volume-averaged time evolution of the available potential energy density ⟨EA⟩𝒱, and of the different contributions to the kinetic ⟨EK⟩𝒱 volume energy density. Bottom: Volume-averaged time evolution of the APE injection rate ⟨εi⟩𝒱, APE thermal dissipation rate −⟨εκ⟩𝒱, and the (opposite amount of) reversible buoyancy work −⟨𝒜⟩𝒱 during the same run. Dashed lines are indicative of negative quantities whose sign has been switched for the purpose of visualisation.
Current usage metrics show cumulative count of Article Views (full-text article views including HTML views, PDF and ePub downloads, according to the available data) and Abstracts Views on Vision4Press platform.
Data correspond to usage on the plateform after 2015. The current usage metrics is available 48-96 hours after online publication and is updated daily on week days.
Initial download of the metrics may take a while.