Fig. C.1.
Download original image
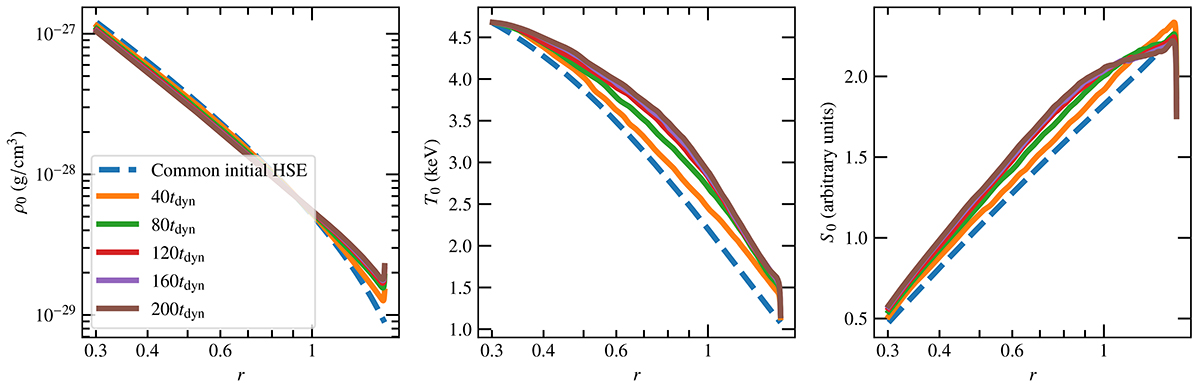
Time evolution of the stratified ICM atmosphere during the simulation with the local HSE BC of Zingale et al. (2002). Shown are the density ρ0 (in g/cm3, left); temperature T0 (in keV, centre); and entropy S0 (right) profiles. In dashed lines: Initial profiles. In plain lines: Same profiles but displayed at various times. This figure should be compared to Fig. 1, which was obtained with the BCs described in Sect. 3.3.
Current usage metrics show cumulative count of Article Views (full-text article views including HTML views, PDF and ePub downloads, according to the available data) and Abstracts Views on Vision4Press platform.
Data correspond to usage on the plateform after 2015. The current usage metrics is available 48-96 hours after online publication and is updated daily on week days.
Initial download of the metrics may take a while.