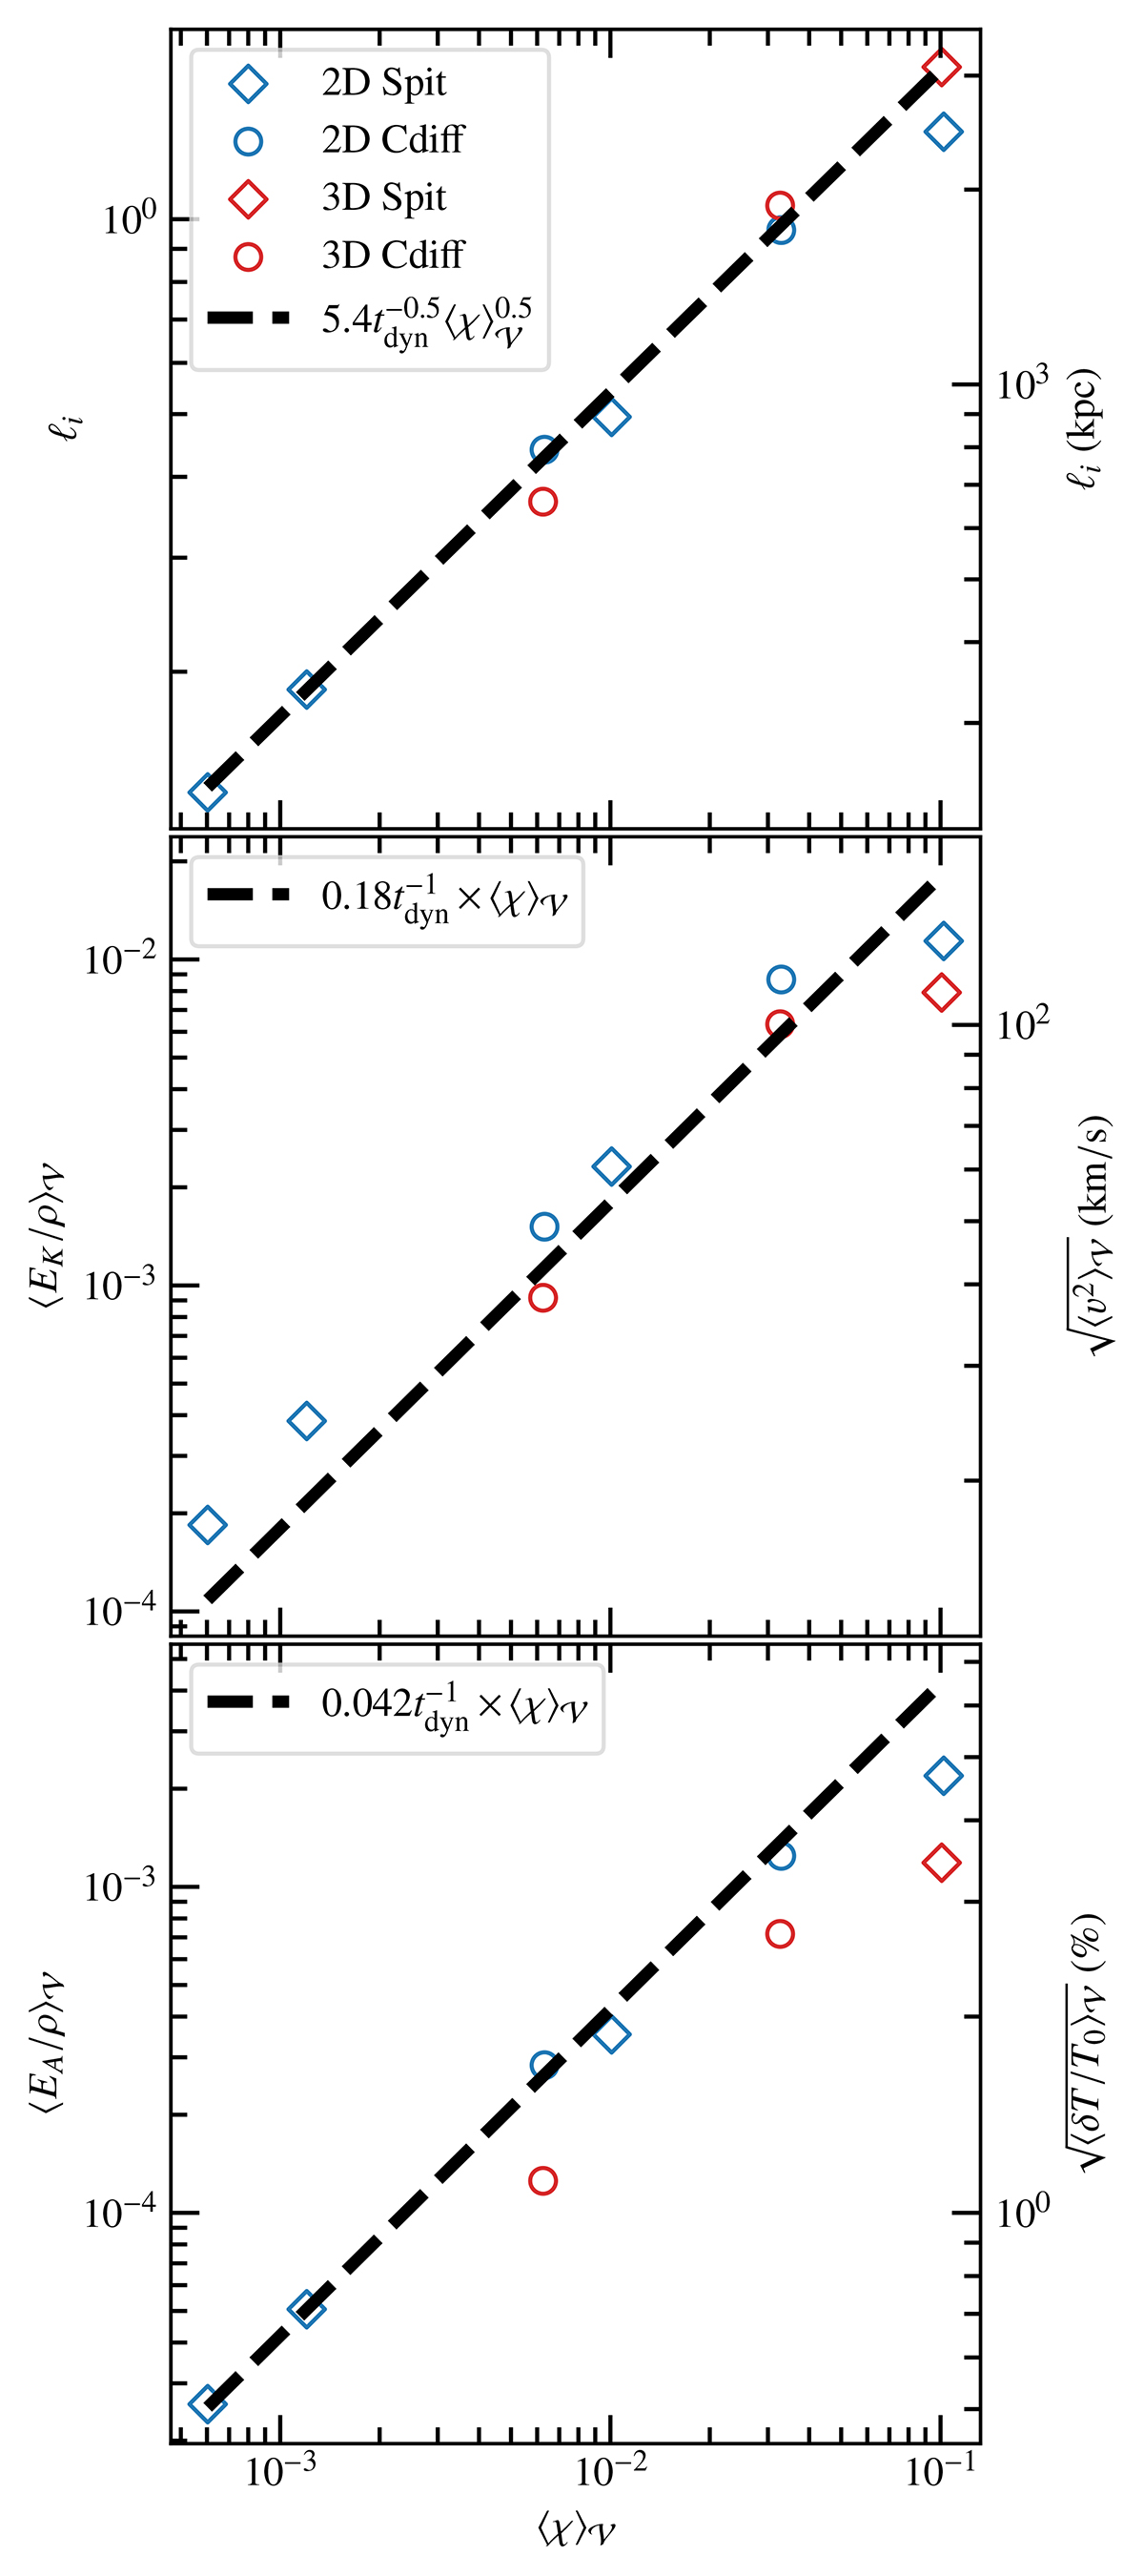
Fig. 5.
Download original image
MTI scaling laws. Volume average of the turbulent injection length (top), the velocity fluctuation strength (middle), and specific APE (bottom), as a function of the volume-averaged thermal diffusivity, for all simulations in Table 2. Diamonds (respectively, circles) correspond to runs with Spitzer (respectively, constant diffusivity) conduction profile; while the colour blue (resp. red) stands for 2D (resp. 3D) runs.
Current usage metrics show cumulative count of Article Views (full-text article views including HTML views, PDF and ePub downloads, according to the available data) and Abstracts Views on Vision4Press platform.
Data correspond to usage on the plateform after 2015. The current usage metrics is available 48-96 hours after online publication and is updated daily on week days.
Initial download of the metrics may take a while.