Fig. 3.
Download original image
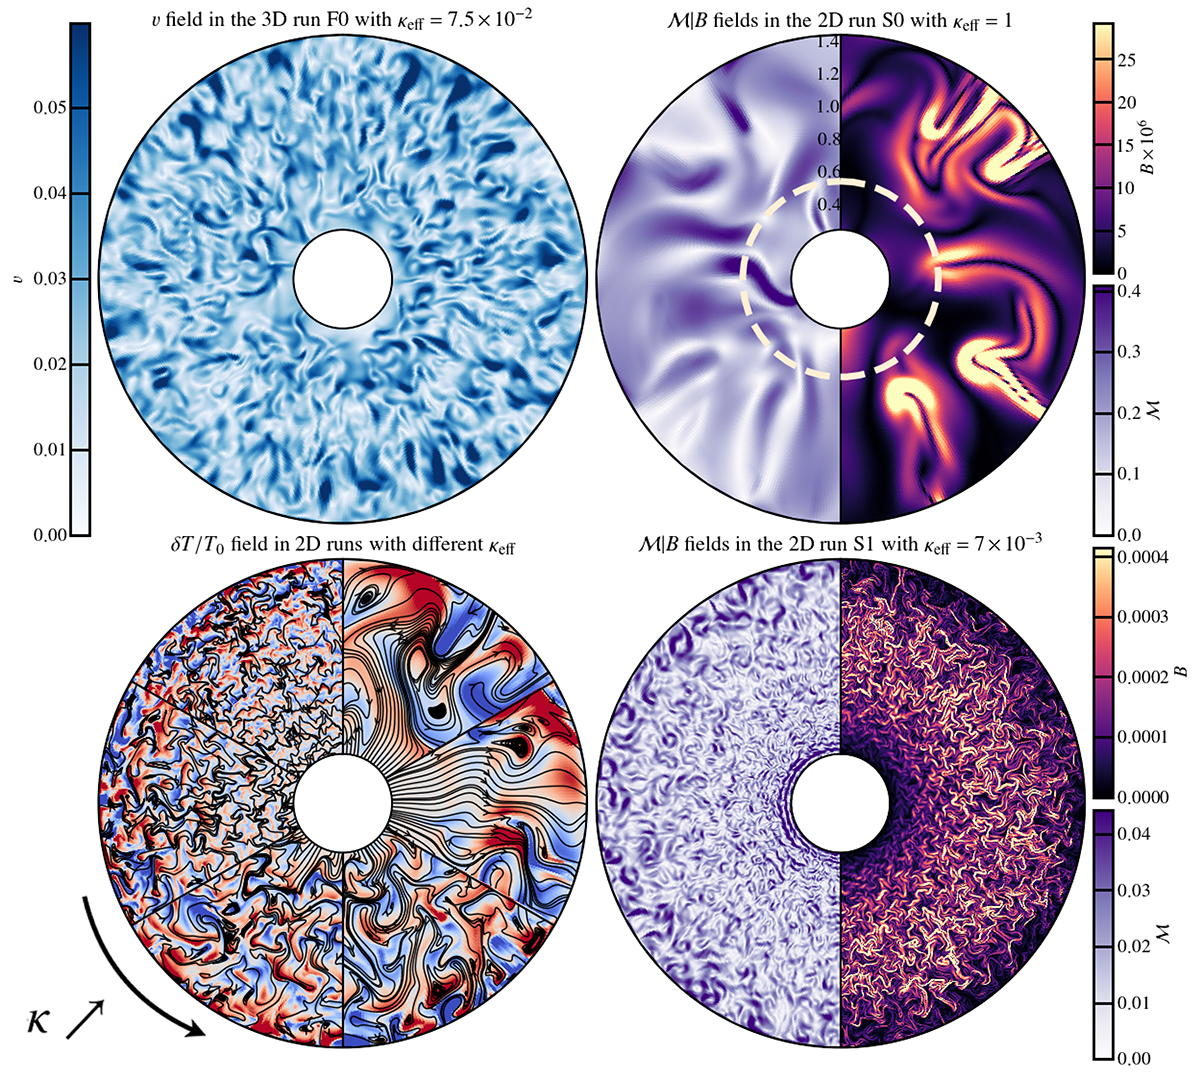
Visualisation of magneto-thermal turbulence in the simulated outskirts of galaxy clusters. Top left: Velocity field in the equatorial plane (r,φ) of the 3D run F0 at saturation. Top right: Mach number (left half) and magnetic strength (right half) snapshots of the 2D run S0 at saturation. Bottom right: Same but for the 2D run S1. Bottom left: Temperature fluctuation maps and magnetic field lines (in black). Different 2D runs are shown in each sixth of the pie and are ranked (counter-clockwise, starting from the top-left part) by increasing effective thermal conductivity κeff, as in Table 2. In the latter plot, the colour map is scaled independently for each sixth of the pie. Reddish blobs are hotter than the spherical average, and blueish fluid elements are colder. The beige dashed line at 0.6Rvir on the top-right donut indicates the limit beyond which the ATHENA/X-IFU would collect less than 1 × 10⁶ photons in the 0.2 − 12 keV range during a 1 Ms observation (Kempf et al. 2023, see the discussion later in Sect. 6.1), as computed prior to the recent X-IFU design-to-cost exercise (Barret et al. 2023).
Current usage metrics show cumulative count of Article Views (full-text article views including HTML views, PDF and ePub downloads, according to the available data) and Abstracts Views on Vision4Press platform.
Data correspond to usage on the plateform after 2015. The current usage metrics is available 48-96 hours after online publication and is updated daily on week days.
Initial download of the metrics may take a while.