Fig. 1.
Download original image
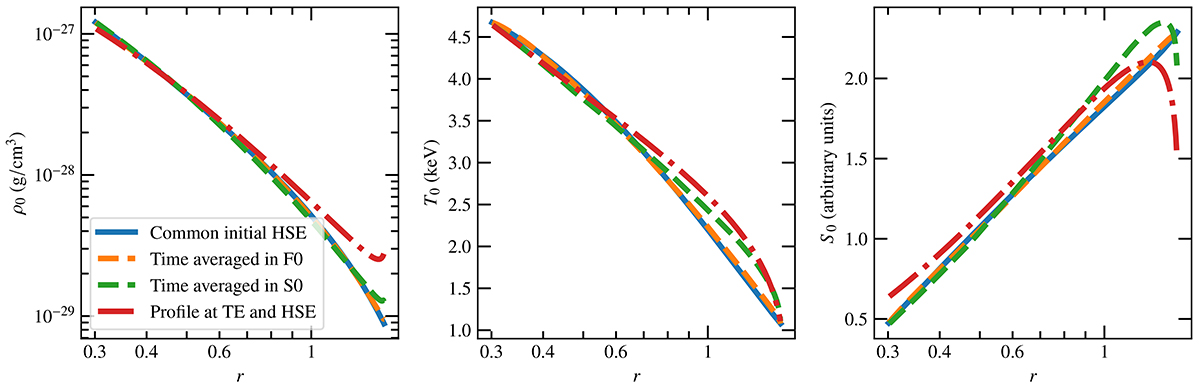
Stratified ICM atmosphere. The density ρ0 (in g/cm3, left); temperature T0 (in keV, centre); and entropy S0 (right) profiles are shown. In blue: Initial profiles common to all simulations. In yellow: Same profiles but averaged over time for the 3D run F0 with κeff = 0.075. In green: Same but for the 2D run S0 with a realistic Spitzer conduction (see discussion in Sect. 4.3). In red: ICM atmosphere at both hydrostatic and thermal equilibria in the presence of a hypothetical background heat flux with a Spitzer conductivity, Eq. (13), subject to the same boundary conditions on the temperature (for comparison only).
Current usage metrics show cumulative count of Article Views (full-text article views including HTML views, PDF and ePub downloads, according to the available data) and Abstracts Views on Vision4Press platform.
Data correspond to usage on the plateform after 2015. The current usage metrics is available 48-96 hours after online publication and is updated daily on week days.
Initial download of the metrics may take a while.