Fig. 9
Download original image
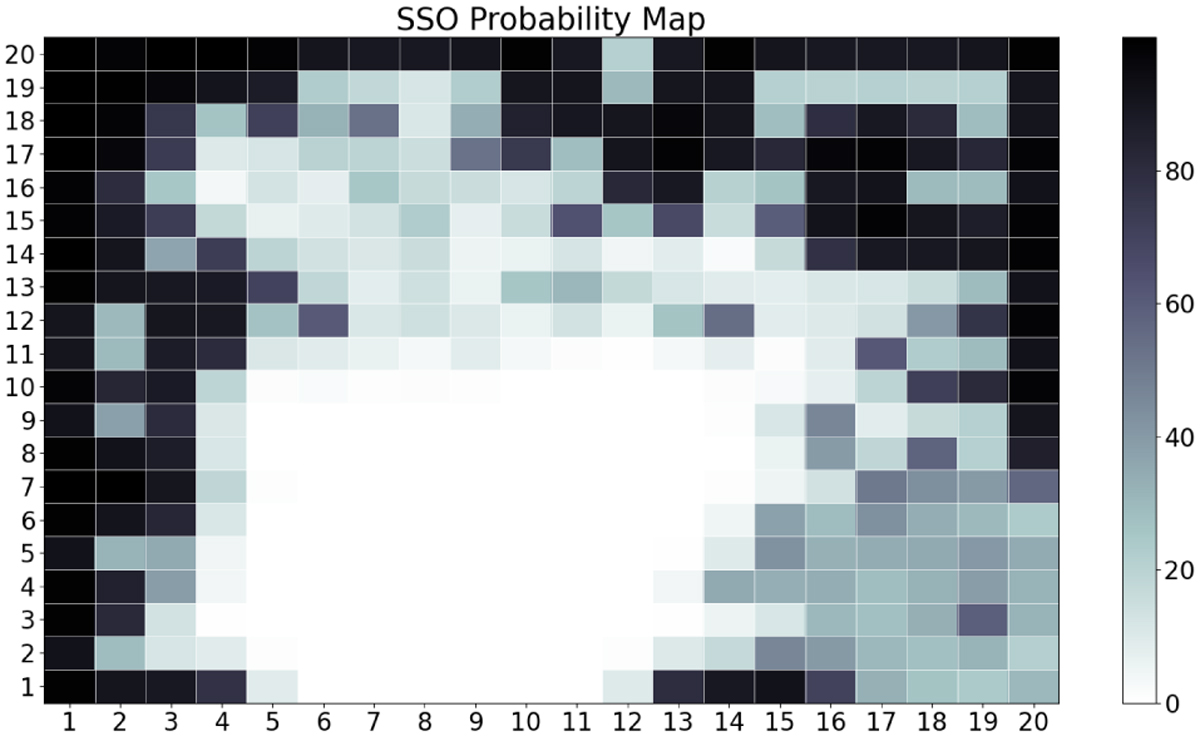
SSO probability map (for a 20 × 20 SOM) associated with the trained neural network (see text for details). The value of each pixel (according to the associated colour bar) gives the normalised probability that the data falling in that particular neuron belongs to the SSO class. The probability is normalised so that by summing up the probability per class, one gets exactly 100%.
Current usage metrics show cumulative count of Article Views (full-text article views including HTML views, PDF and ePub downloads, according to the available data) and Abstracts Views on Vision4Press platform.
Data correspond to usage on the plateform after 2015. The current usage metrics is available 48-96 hours after online publication and is updated daily on week days.
Initial download of the metrics may take a while.