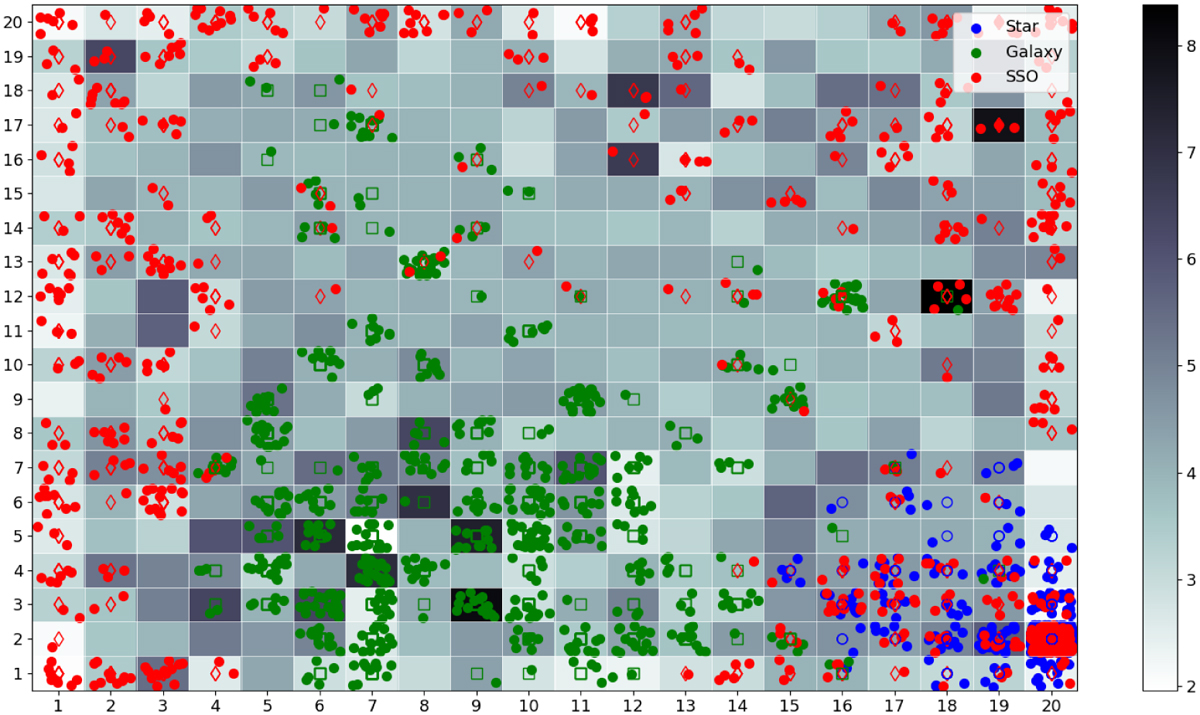
Fig. 8
Download original image
20 × 20 U-matrix of the same SOM given in Fig. 7 but exposed to a test data set. Having the correct class of the test data, we flagged the objects falling in each neuron with a different symbol and colour, and thus confirmed the capability of the (early stopped) SOM to classify a new data set. The meaning of the symbols and colours is as described in Fig. 7.
Current usage metrics show cumulative count of Article Views (full-text article views including HTML views, PDF and ePub downloads, according to the available data) and Abstracts Views on Vision4Press platform.
Data correspond to usage on the plateform after 2015. The current usage metrics is available 48-96 hours after online publication and is updated daily on week days.
Initial download of the metrics may take a while.