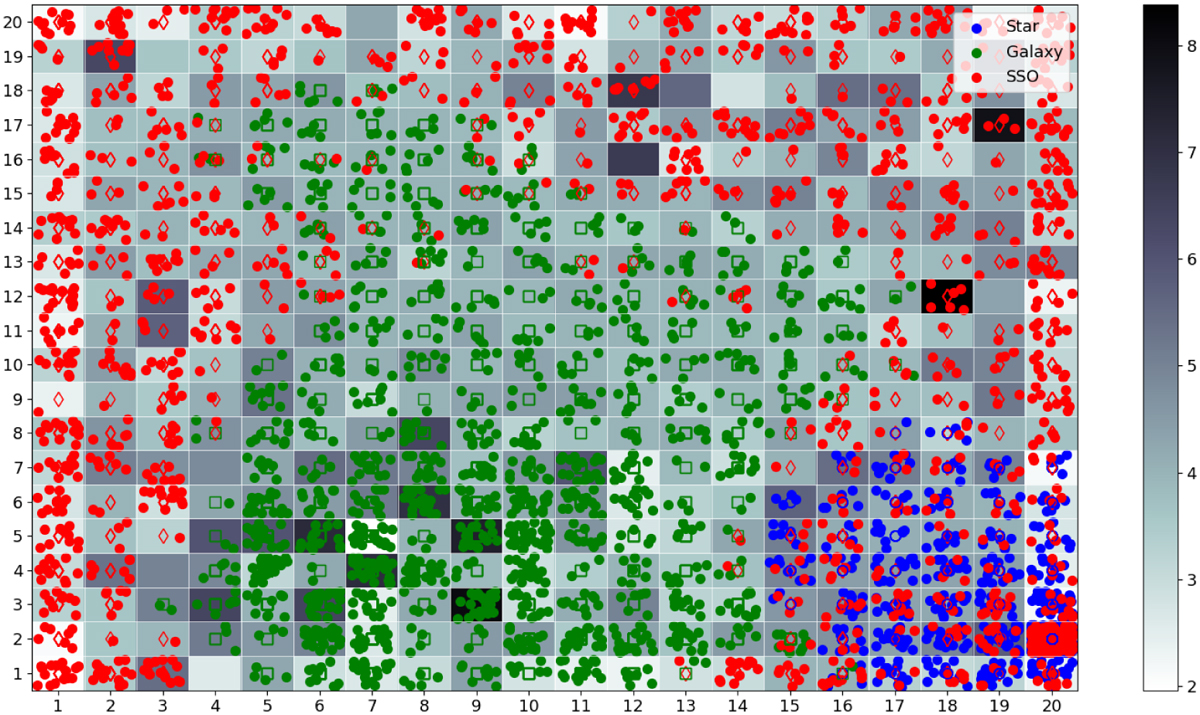
Fig. 7
Download original image
20 × 20 U-matrix of the SOM trained to classify stars, galaxies, and SSOs. Using the training data, we superimposed a different symbol and colour in the middle of each node for each type of input vector (blue circles for stars, green squares for galaxies, and red diamonds for SSOs), confirming that the SOM correctly classified the data. The dots appearing in each pixel (with a different colour for each class) indicate the number of objects of the particular class classified by the SOM. The underlying grey-scale image represents the U-matrix associated with the trained SOM, while numbers along the axes represent the neuron position in the map.
Current usage metrics show cumulative count of Article Views (full-text article views including HTML views, PDF and ePub downloads, according to the available data) and Abstracts Views on Vision4Press platform.
Data correspond to usage on the plateform after 2015. The current usage metrics is available 48-96 hours after online publication and is updated daily on week days.
Initial download of the metrics may take a while.