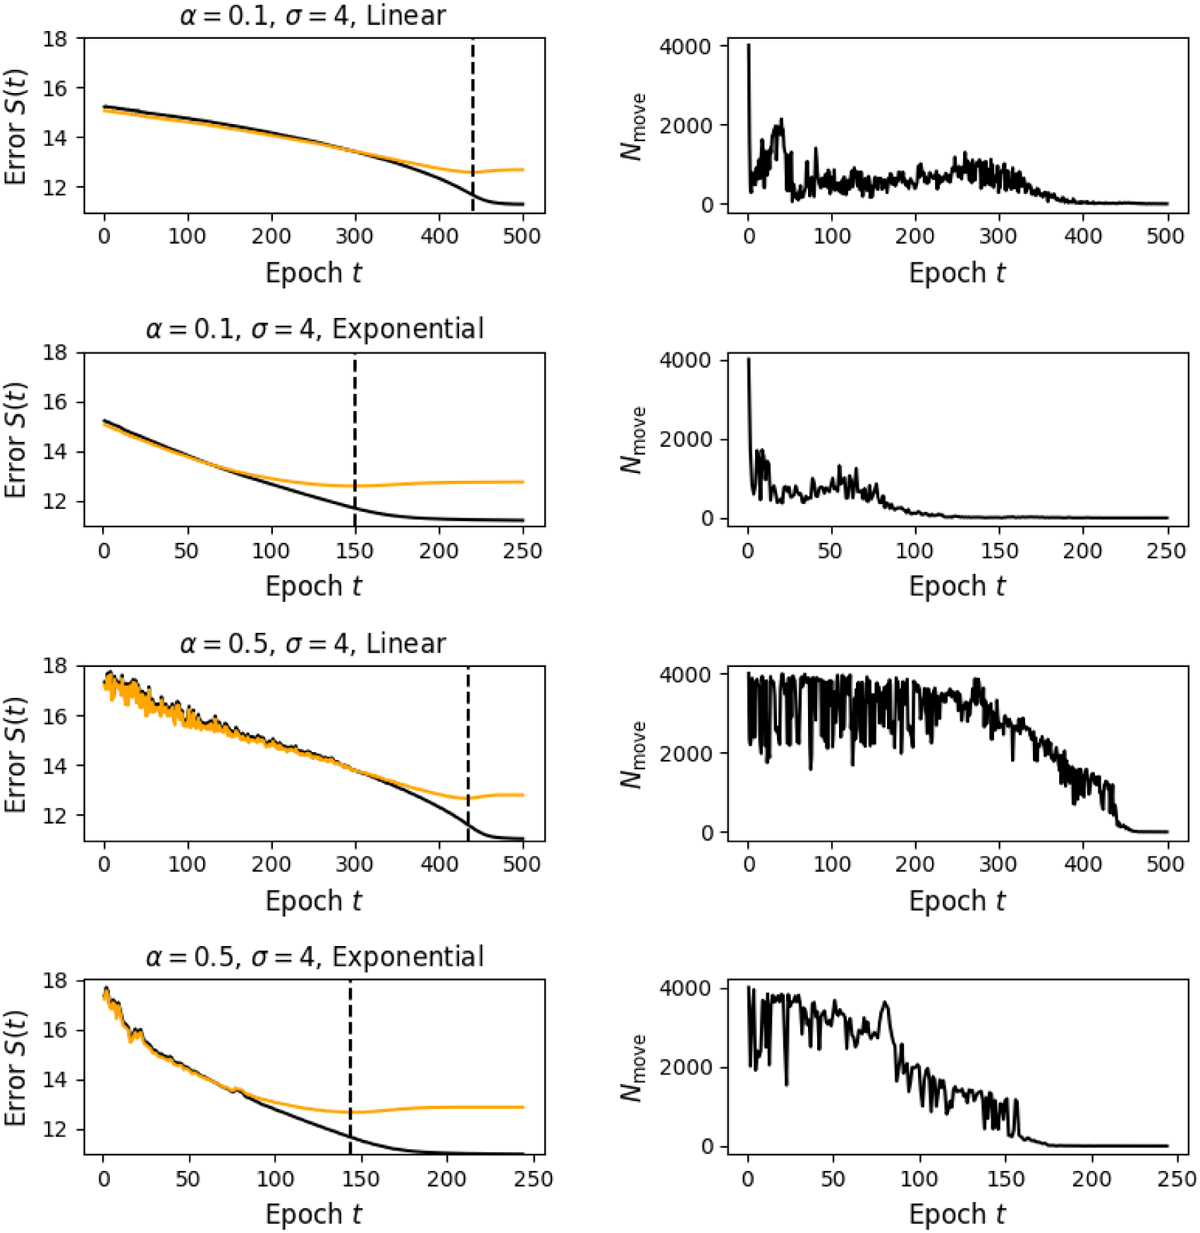
Fig. 6
Download original image
Performance of the SOM evaluated by calculating the average map error, S (t) (solid black line, left panels), and number of movements, Nmove(t), in a given epoch, t (right panels). In the left panels, we also give the average error of the SOM when applied to the validation input data (yellow line). The dashed vertical lines represent, for each panel, the epoch associated with the early-stopping method (see text for details).
Current usage metrics show cumulative count of Article Views (full-text article views including HTML views, PDF and ePub downloads, according to the available data) and Abstracts Views on Vision4Press platform.
Data correspond to usage on the plateform after 2015. The current usage metrics is available 48-96 hours after online publication and is updated daily on week days.
Initial download of the metrics may take a while.