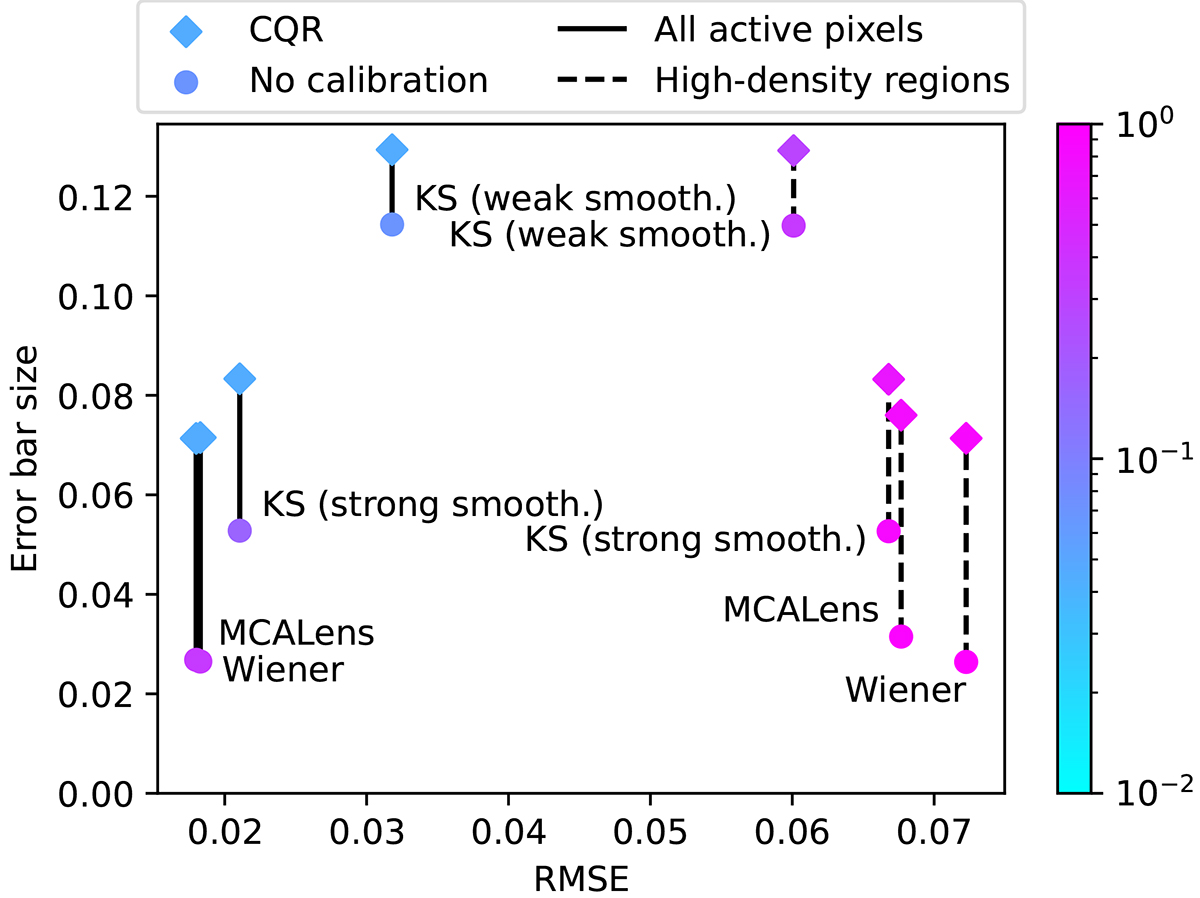
Fig. 9.

Download original image
Mean length of prediction intervals (Sect. 4.2.4) plotted against RMSE (Sect. 4.2.2) before and after calibration using additive CQR and with and without filtering on high-density regions. Marker colors indicate empirical miscoverage rates (Sect. 4.2.3). The coverage guarantee (34) applies only after calibration (blue diamonds atop the solid lines). We notice that when filtering on high-density regions, the coverage property no longer holds (pink diamonds atop the dashed lines).
Current usage metrics show cumulative count of Article Views (full-text article views including HTML views, PDF and ePub downloads, according to the available data) and Abstracts Views on Vision4Press platform.
Data correspond to usage on the plateform after 2015. The current usage metrics is available 48-96 hours after online publication and is updated daily on week days.
Initial download of the metrics may take a while.


