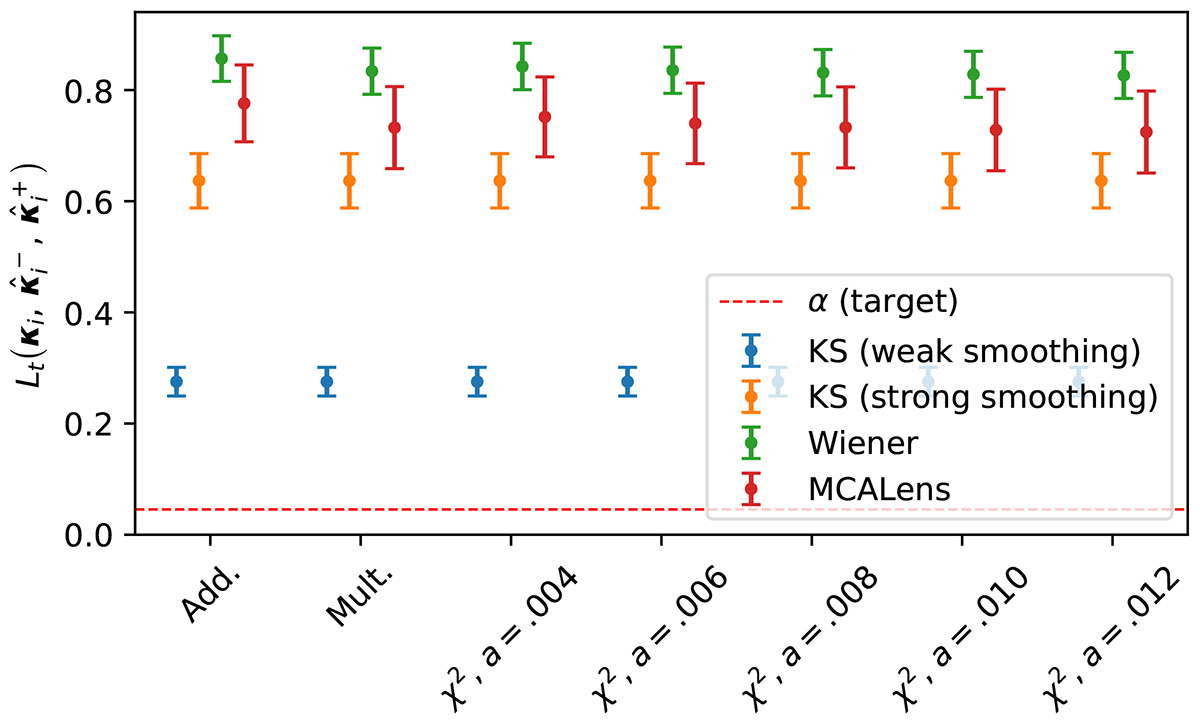
Fig. 7.
Download original image
Empirical miscoverage rate after calibration with CQR, computed on regions of higher density. Following Sect. 4.2.2, only pixels k with |κi[k]| ≥ t = 4.8 × 10⁻² were considered. Unlike in Fig. 5a, where the miscoverage rate is computed over all pixels, the measured values in this case deviate drastically from the target. Consequently, the size of the error bars is underestimated in these areas.
Current usage metrics show cumulative count of Article Views (full-text article views including HTML views, PDF and ePub downloads, according to the available data) and Abstracts Views on Vision4Press platform.
Data correspond to usage on the plateform after 2015. The current usage metrics is available 48-96 hours after online publication and is updated daily on week days.
Initial download of the metrics may take a while.