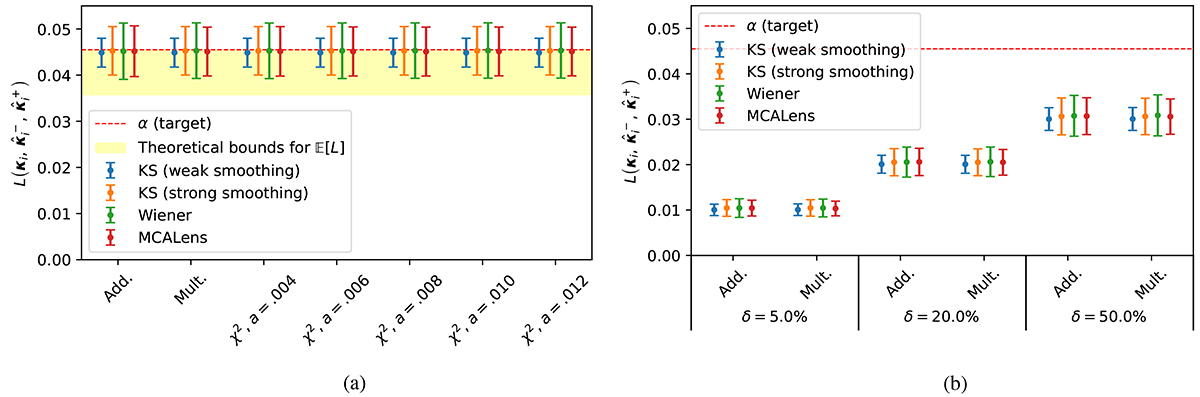
Fig. 5.
Download original image
Empirical miscoverage rate after calibration with CQR (Fig. 5a) and RCPS (Fig. 5b). The means and standard deviations were computed over the test set (γi, κi)i = n + 1m for various error levels δ (RCPS only) and various families of calibration functions (gλ)λ. More details are provided in the note of Table D.1. The theoretical bounds for CQR introduced in Eq. (34) are represented by the yellow area in Fig. 5a. These plots indicate that CQR achieves miscoverage rates that are, on average, close to the target α, whereas RCPS tends to produce overconservative bounds, even for large values of δ. (a) CQR, (b) RCPS.
Current usage metrics show cumulative count of Article Views (full-text article views including HTML views, PDF and ePub downloads, according to the available data) and Abstracts Views on Vision4Press platform.
Data correspond to usage on the plateform after 2015. The current usage metrics is available 48-96 hours after online publication and is updated daily on week days.
Initial download of the metrics may take a while.