Fig. 2
Download original image
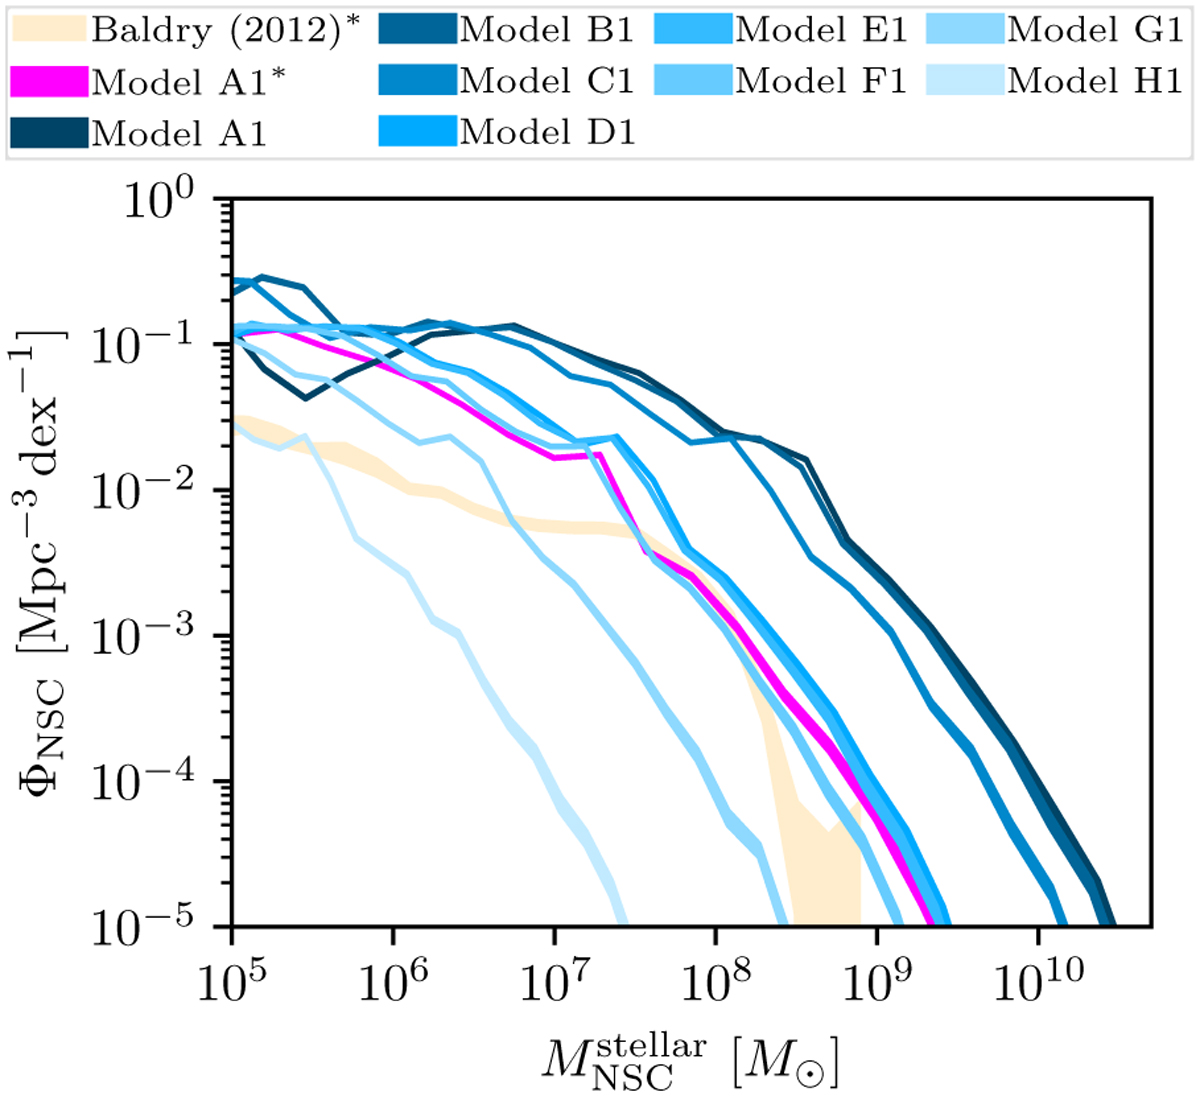
NSC stellar mass function for the models listed in Table 1 compared to the observed NSC mass function derived from the ![]() correlation. The orange region is the observed NSC mass function derived from the galaxy stellar mass function of Baldry et al. (2012), while the magenta line is the NSC mass function derived from the galaxy stellar mass function for model A1; both are denoted with an asterisk in the legend. The error in simulations is estimated as
correlation. The orange region is the observed NSC mass function derived from the galaxy stellar mass function of Baldry et al. (2012), while the magenta line is the NSC mass function derived from the galaxy stellar mass function for model A1; both are denoted with an asterisk in the legend. The error in simulations is estimated as ![]() , where N is the number of NSCs in the bin.
, where N is the number of NSCs in the bin.
Current usage metrics show cumulative count of Article Views (full-text article views including HTML views, PDF and ePub downloads, according to the available data) and Abstracts Views on Vision4Press platform.
Data correspond to usage on the plateform after 2015. The current usage metrics is available 48-96 hours after online publication and is updated daily on week days.
Initial download of the metrics may take a while.