Fig. 4.
Download original image
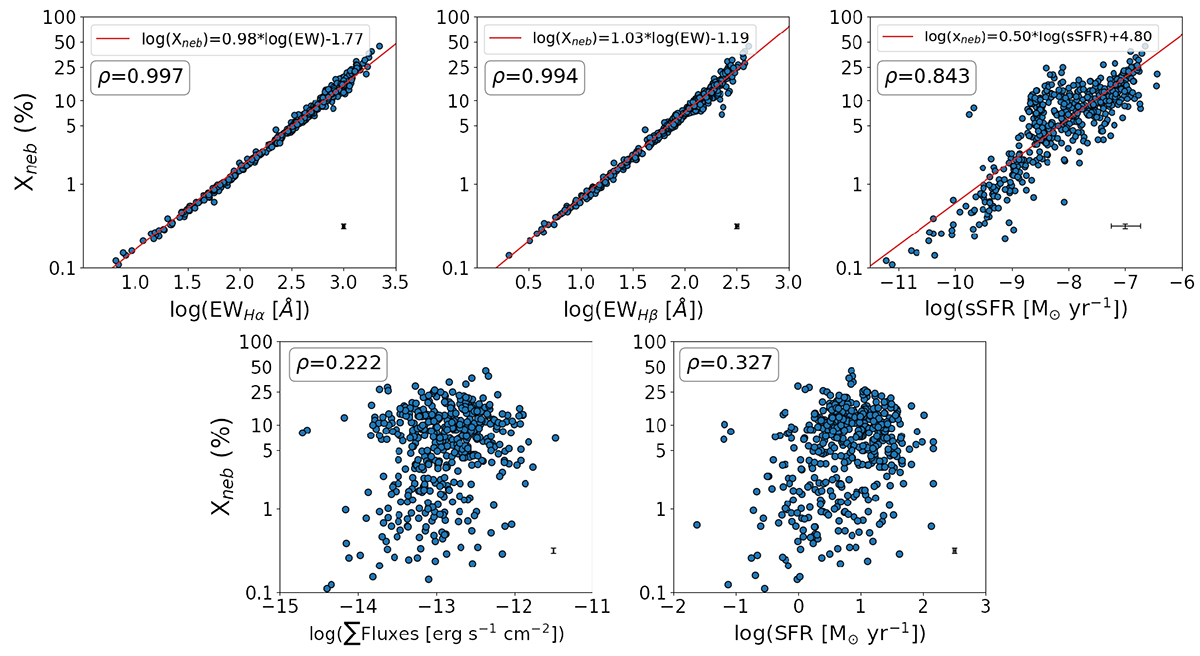
Relation between Xneb and the different tracers considered in this work: EW of Hα (upper left), EW of Hβ (upper middle), sSFR (upper right), sum of the flux of the most prominent emission lines (lower left) and SFR (lower right). In the upper left of each panel, we present the Pearson correlation coefficient assuming a linear fit to the data. For the selected best tracers of Xneb, the red line is the derived best linear fit and the resulting equation is presented in the legend. The median error of the data is presented in the bottom right corner. The axes are in logarithmic scale.
Current usage metrics show cumulative count of Article Views (full-text article views including HTML views, PDF and ePub downloads, according to the available data) and Abstracts Views on Vision4Press platform.
Data correspond to usage on the plateform after 2015. The current usage metrics is available 48-96 hours after online publication and is updated daily on week days.
Initial download of the metrics may take a while.