Fig. 2.
Download original image
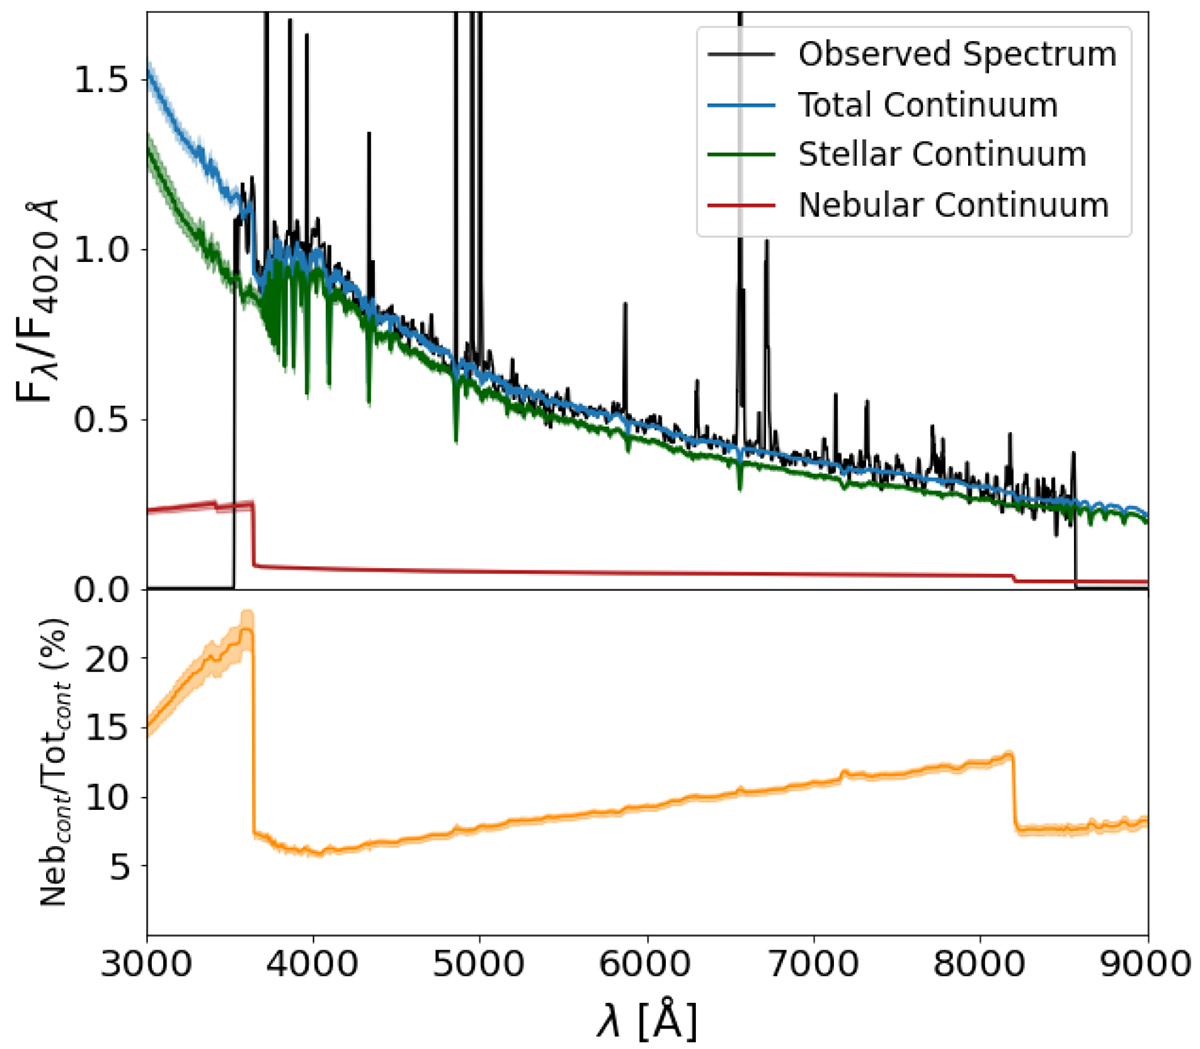
Model fitted by FADO to a galaxy in our sample with Xneb = 10%. Upper panel: observed spectrum (black line) and total, stellar and nebular continuum fitted by FADO (blue, green and red lines, respectively). The shaded regions represent the uncertainty in the estimated models. Bottom panel: ratio between the nebular and total continuum fitted by FADO as a function of wavelength.
Current usage metrics show cumulative count of Article Views (full-text article views including HTML views, PDF and ePub downloads, according to the available data) and Abstracts Views on Vision4Press platform.
Data correspond to usage on the plateform after 2015. The current usage metrics is available 48-96 hours after online publication and is updated daily on week days.
Initial download of the metrics may take a while.