Fig. 9.
Download original image
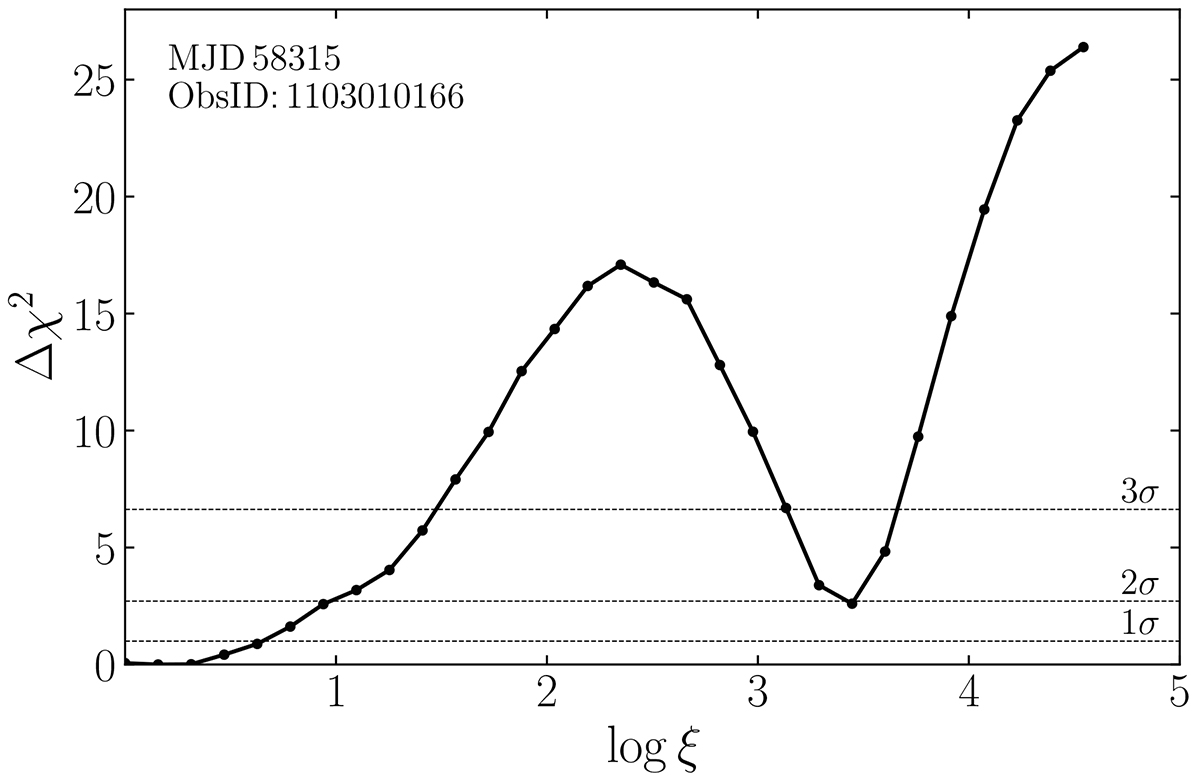
Δχ2 fitting statistics of an example spectrum in the decay phase, plotted vs. different values of the ionization degree log ξ of the relativistic reflection component relxillCp. The sample points are shown as black dots and are connected by solid lines. There are two local minima in this plot, with distinct ionization degrees. We discarded the solution with higher log ξ because it resulted in a vanishing primary emission originating from the corona.
Current usage metrics show cumulative count of Article Views (full-text article views including HTML views, PDF and ePub downloads, according to the available data) and Abstracts Views on Vision4Press platform.
Data correspond to usage on the plateform after 2015. The current usage metrics is available 48-96 hours after online publication and is updated daily on week days.
Initial download of the metrics may take a while.