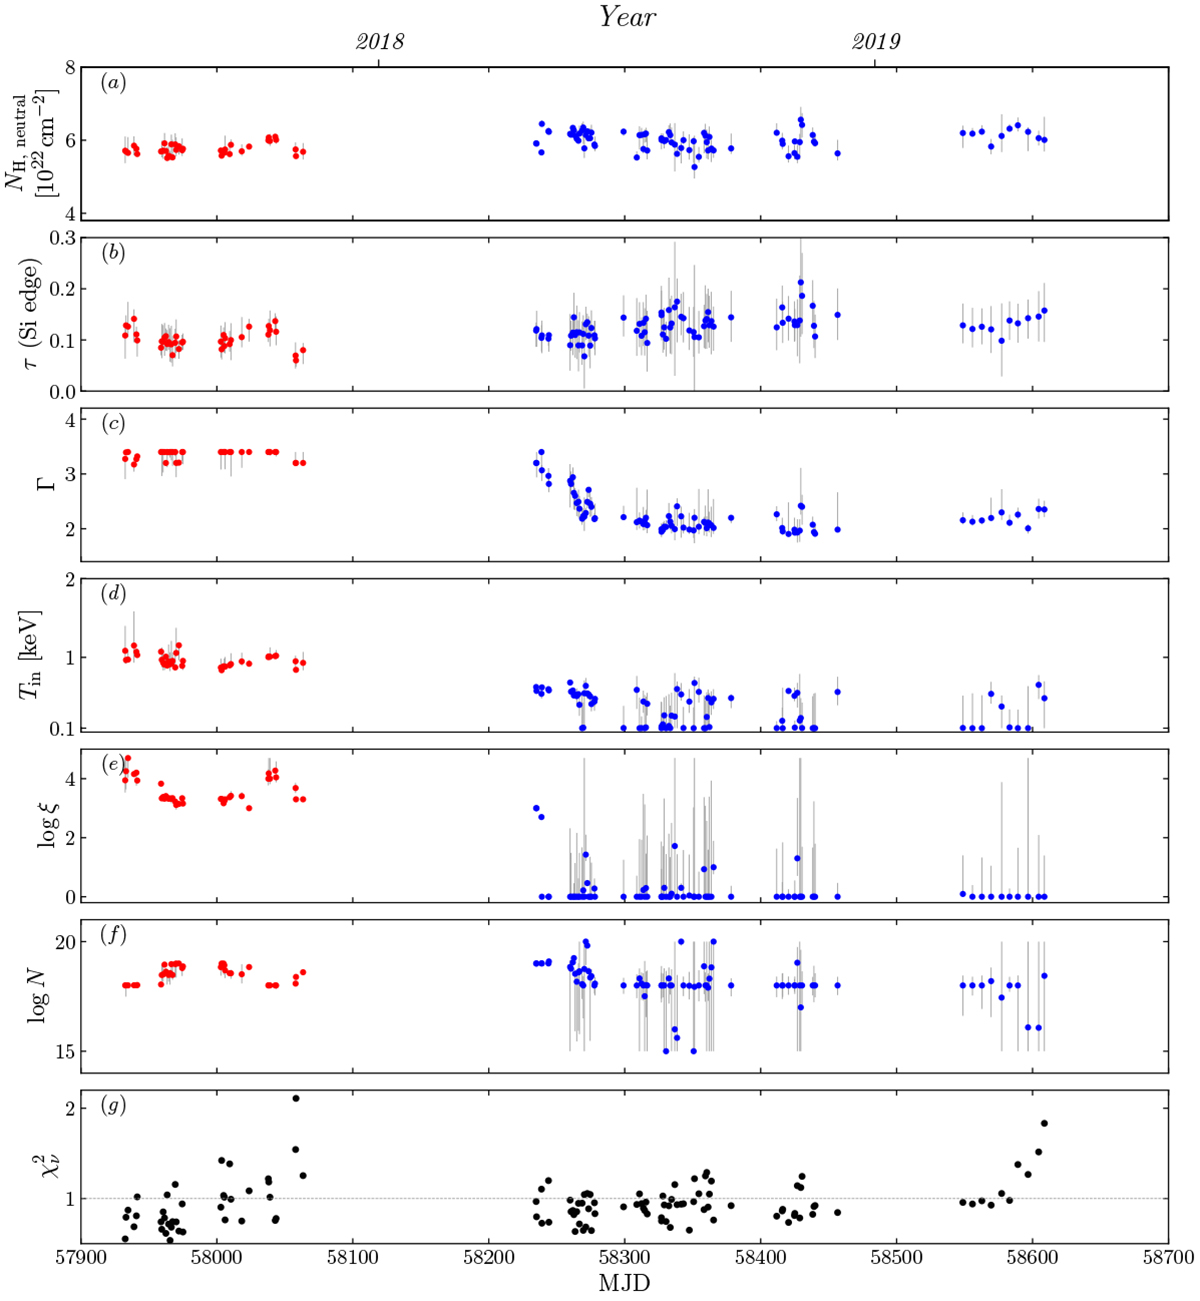
Fig. 7.

Download original image
Evolution of the key parameters measured via the spectral analysis as a function of time. The panels show (from a to g) the equivalent hydrogen column NH of the neutral absorption, the optical depth τ of the additional silicon edge, the photon index Γ, the temperature at the inner edge of the disk Tin, the ionization degree log ξ of the accretion disk, the logarithmic number density of electrons of the accretion disk log N, and the reduced chi-squares χν2 of the best-fits. The red and blue dots denote parameters obtained in the soft state and hard decay phase, respectively.
Current usage metrics show cumulative count of Article Views (full-text article views including HTML views, PDF and ePub downloads, according to the available data) and Abstracts Views on Vision4Press platform.
Data correspond to usage on the plateform after 2015. The current usage metrics is available 48-96 hours after online publication and is updated daily on week days.
Initial download of the metrics may take a while.


