Fig. 5.
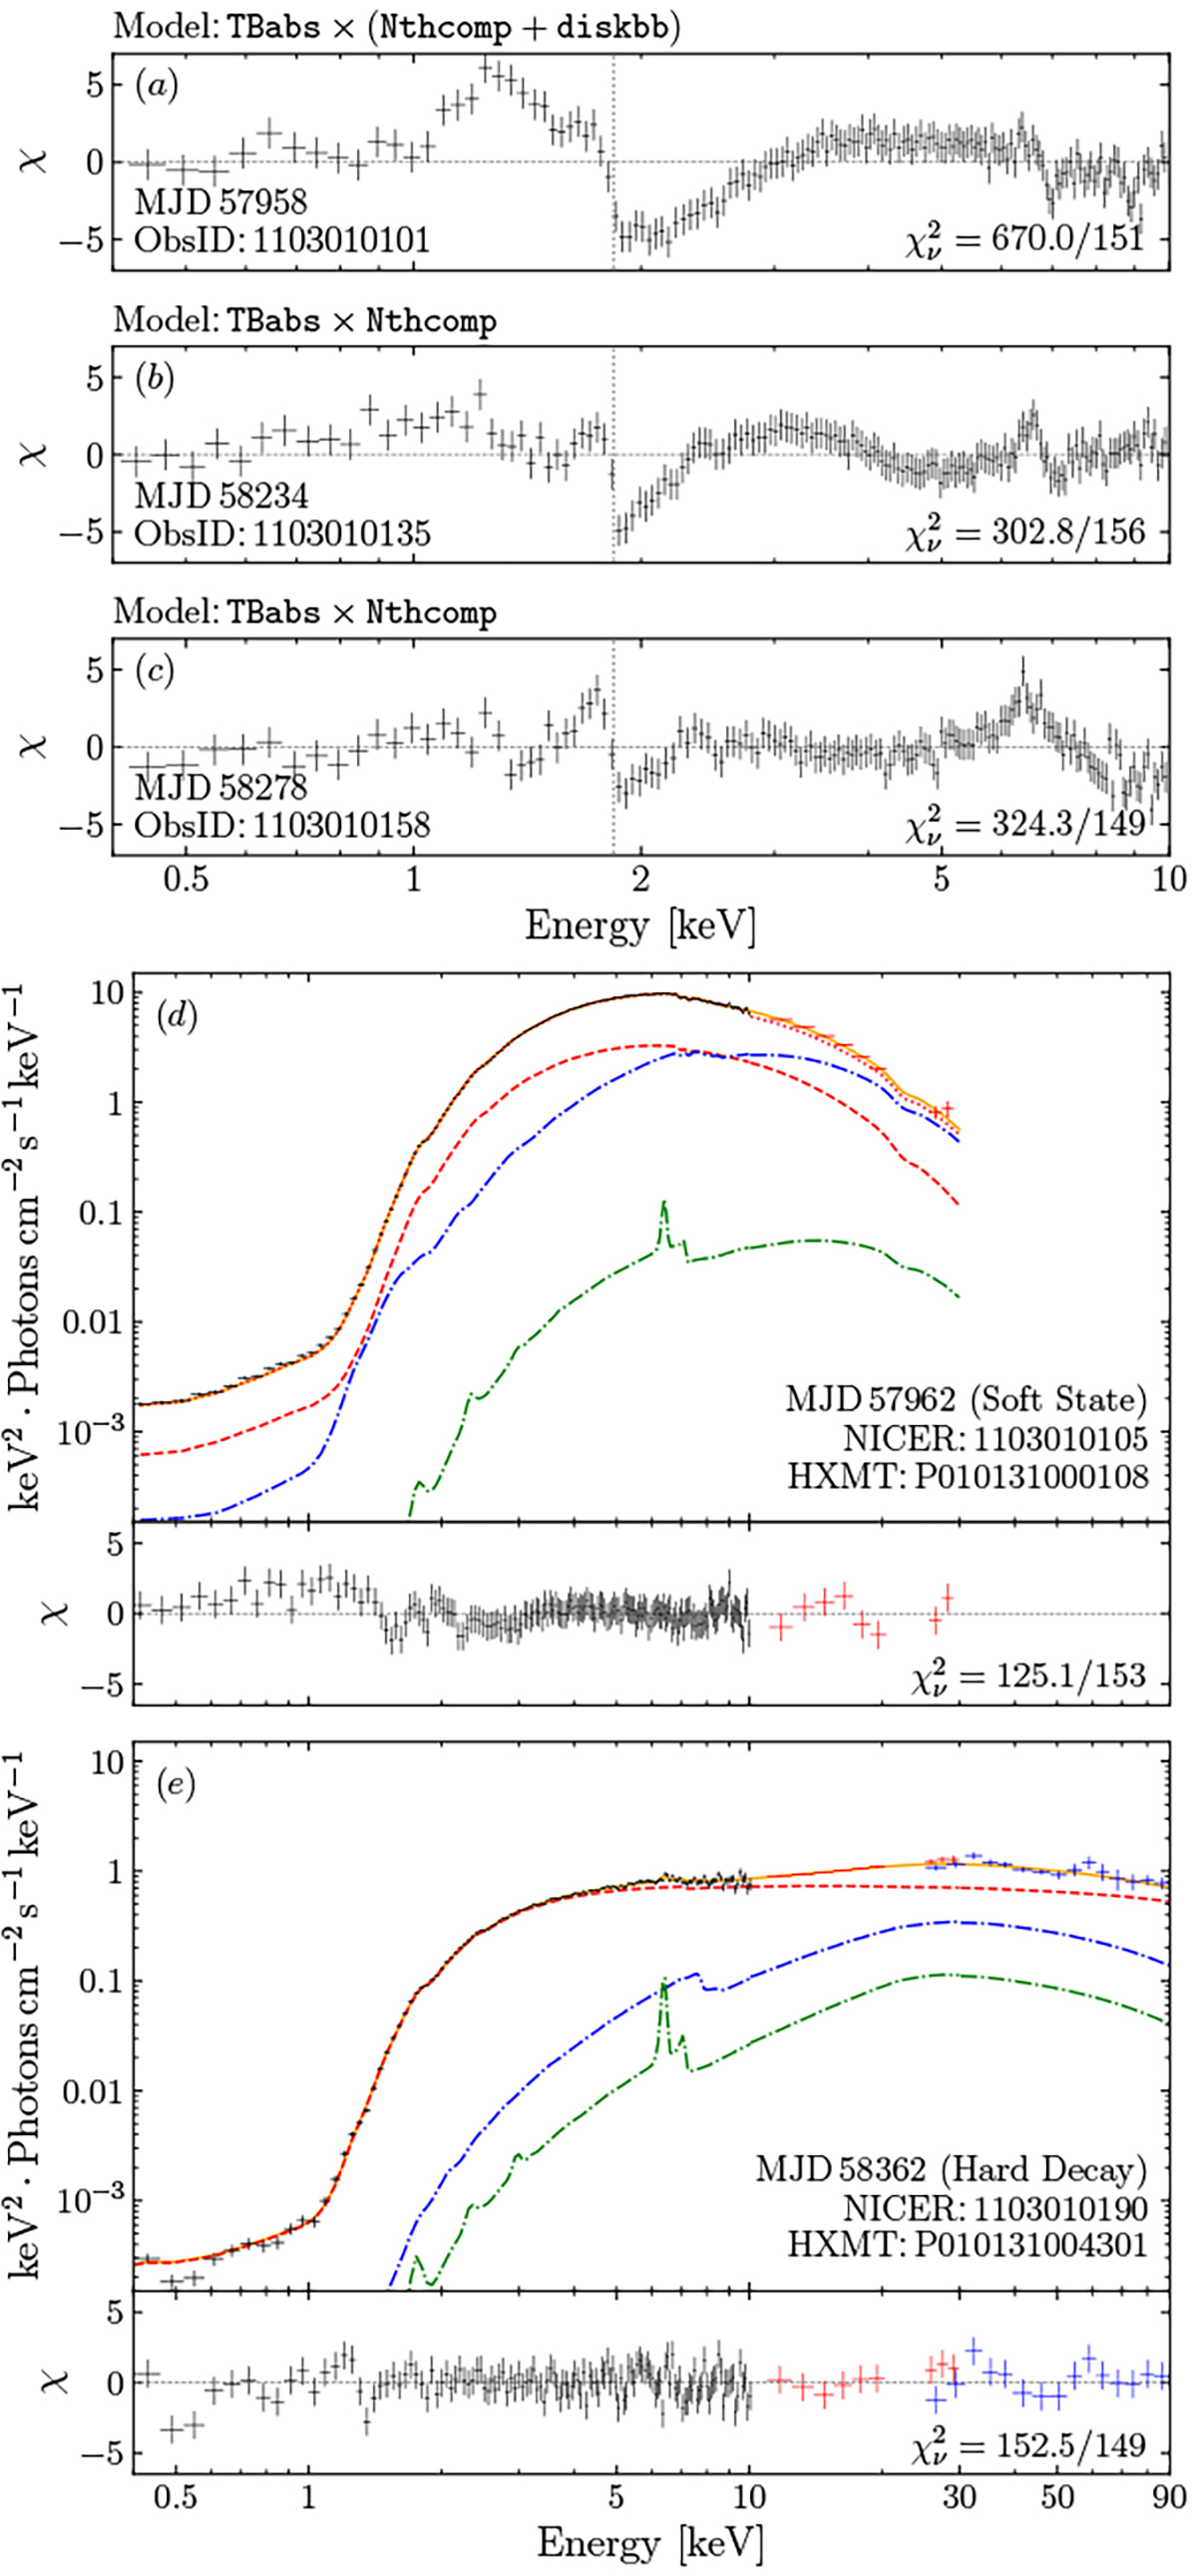
Download original image
The residuals and the spectral composition diagrams for different states. From (a) to (c): Residuals for the preliminary modeling to fit the NICER observation during the soft state (MJD 57958) at the beginning and the middle of the decay phase (MJD 58234 and 58278). An additional silicon absorption edge (1.84 keV, denoted by the dotted line) and a narrow iron Kα line with a cutoff energy lower than 7 keV are plotted as well. From (d) to (e): Two typical merged unfolded spectra of GRS 1915+105 in different states, fit by the physical model illustrated in Eq. (1). Different spectral components, i.e., the power-law continuum, the relativistic reflection component from the accretion disk, and the nonrelativistic reflection component from a distant reflector, are shown with the dashed red line, the dash-dotted blue line, and the dash-dotted line line, respectively. See the text for detailed information.
Current usage metrics show cumulative count of Article Views (full-text article views including HTML views, PDF and ePub downloads, according to the available data) and Abstracts Views on Vision4Press platform.
Data correspond to usage on the plateform after 2015. The current usage metrics is available 48-96 hours after online publication and is updated daily on week days.
Initial download of the metrics may take a while.