Fig. 3.
Download original image
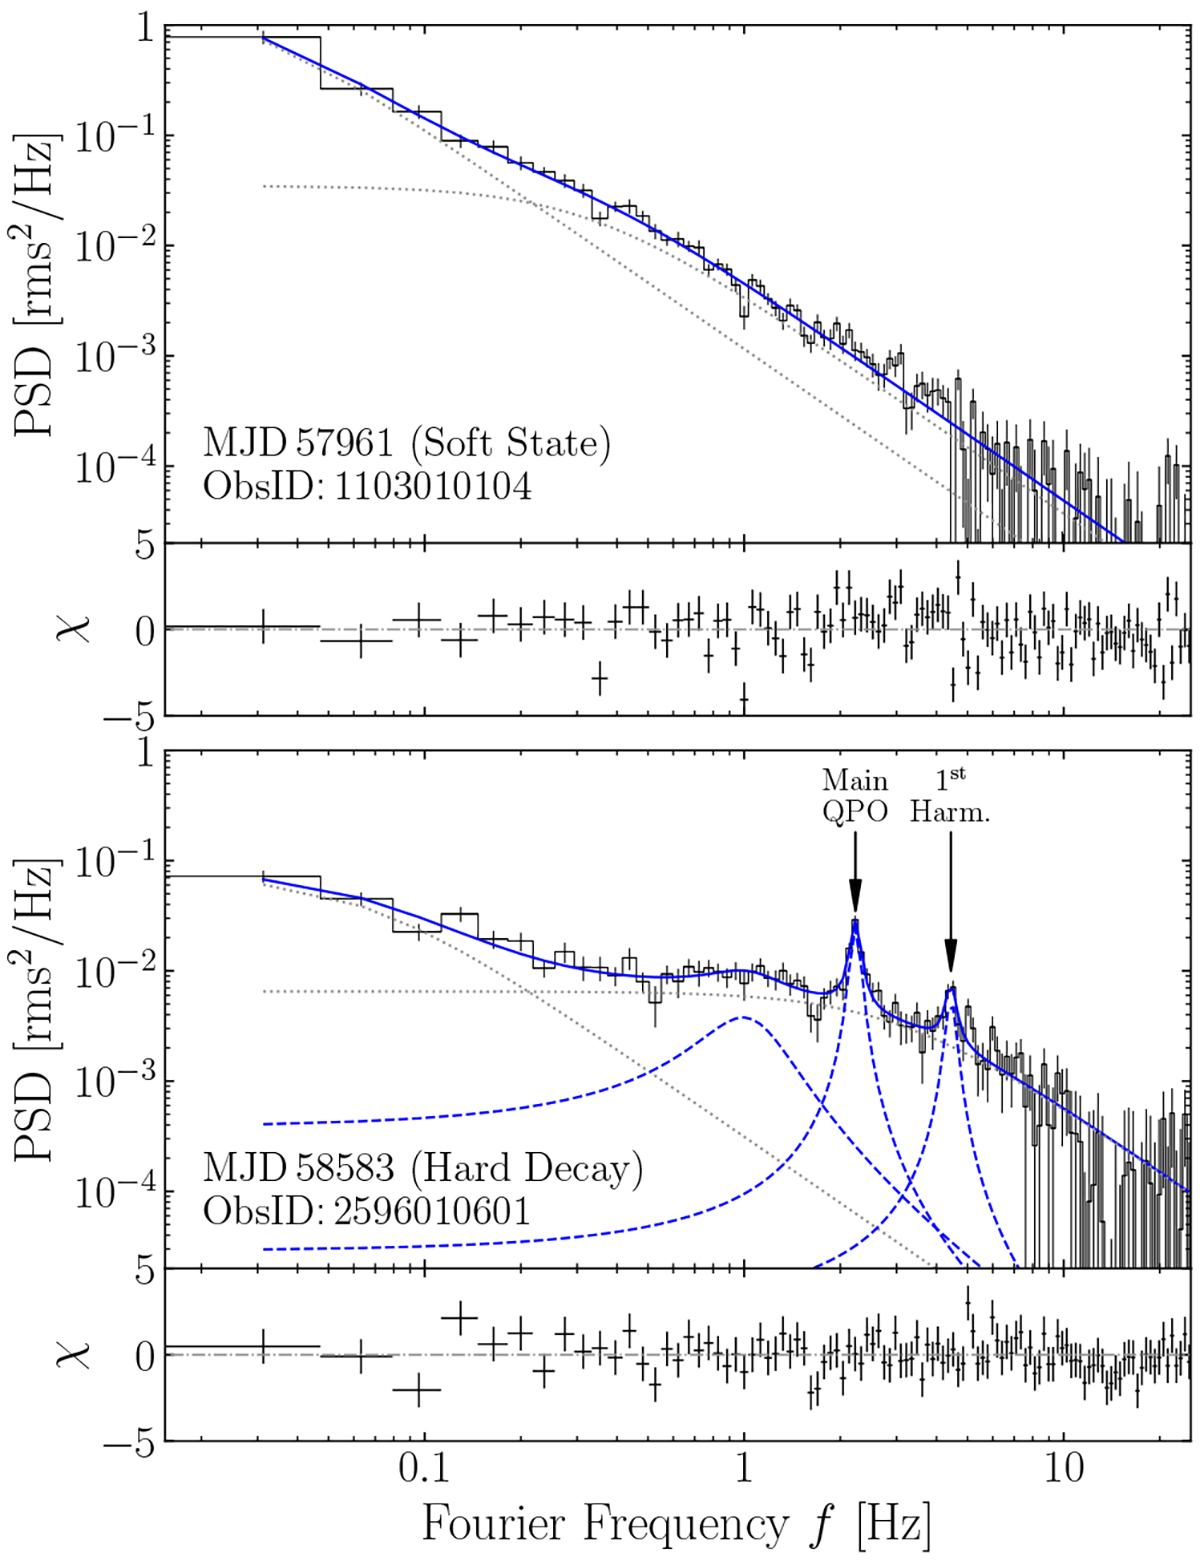
Two typical power spectra produced by NICER data in the soft (upper panel) and hard state during the decay phase (lower panel) with their best-fit models. The Lorentzians with a central frequency at zero are indicated with dotted gray lines, and the Lorentzians with a nonvanishing central frequency are indicated with dashed blue lines. As the best-fit model, the sums of all the Lorentzians are denoted with solid blue lines. The measured central frequencies of the main QPO and the first harmonic in the hard state are ![]() Hz and
Hz and ![]() Hz, respectively.
Hz, respectively.
Current usage metrics show cumulative count of Article Views (full-text article views including HTML views, PDF and ePub downloads, according to the available data) and Abstracts Views on Vision4Press platform.
Data correspond to usage on the plateform after 2015. The current usage metrics is available 48-96 hours after online publication and is updated daily on week days.
Initial download of the metrics may take a while.