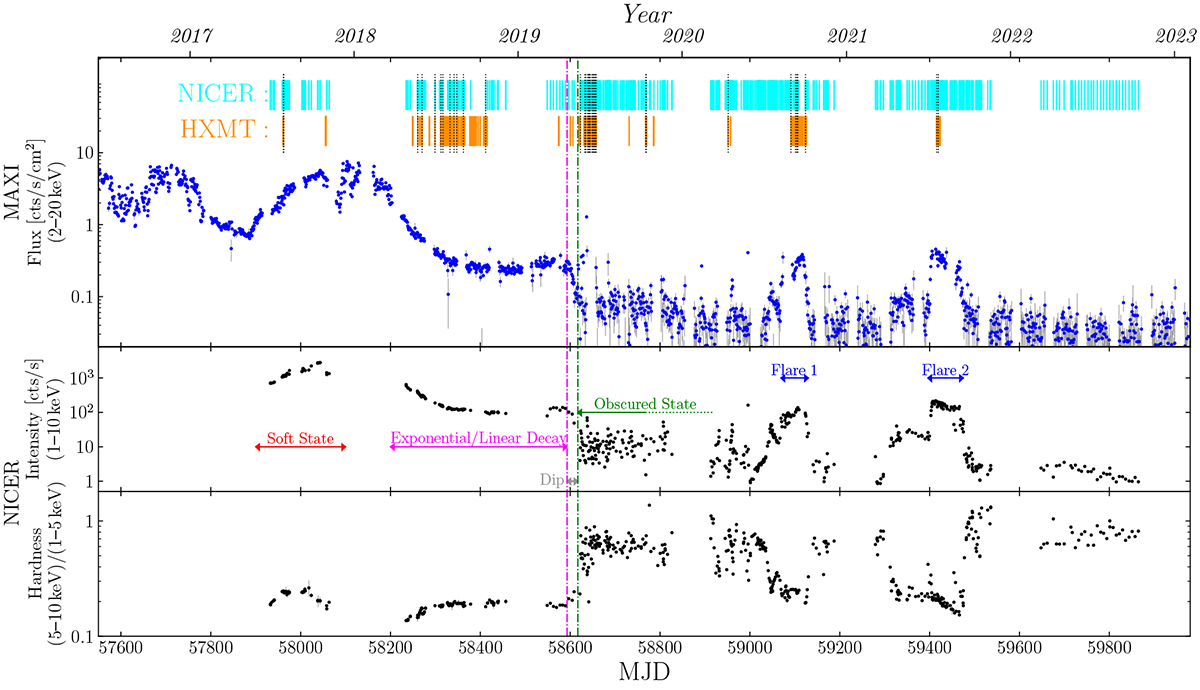
Fig. 1.
Download original image
Long-term behavior of GRS 1915+105 monitored by MAXI and NICER. Top panel: Daily flux measured by MAXI in the 2−20 keV band. The duration of NICER and Insight–HXMT observations is shown at the top with cyan and dark orange stripes. The dotted black lines denote the available quasi-simultaneous observations by two instruments. Middle panel: Intensity of GRS 1915+105, defined by the raw photon count rate registered in the 1−10 keV band of NICER. The spectral states are classified with spectral-timing features and denoted with arrows. More details can be found in the literature. Bottom panel: Hardness of the spectra, defined by the raw count rate between the 5−10 keV band and the 1−5 keV band of NICER. The vertical dash-dotted magenta line (∼MJD 58593) represents the start point of the pre-flare dip, and the dash-dotted green line (∼MJD 58617) marks the passing of this source into the obscured state.
Current usage metrics show cumulative count of Article Views (full-text article views including HTML views, PDF and ePub downloads, according to the available data) and Abstracts Views on Vision4Press platform.
Data correspond to usage on the plateform after 2015. The current usage metrics is available 48-96 hours after online publication and is updated daily on week days.
Initial download of the metrics may take a while.