Fig. 7.
Download original image
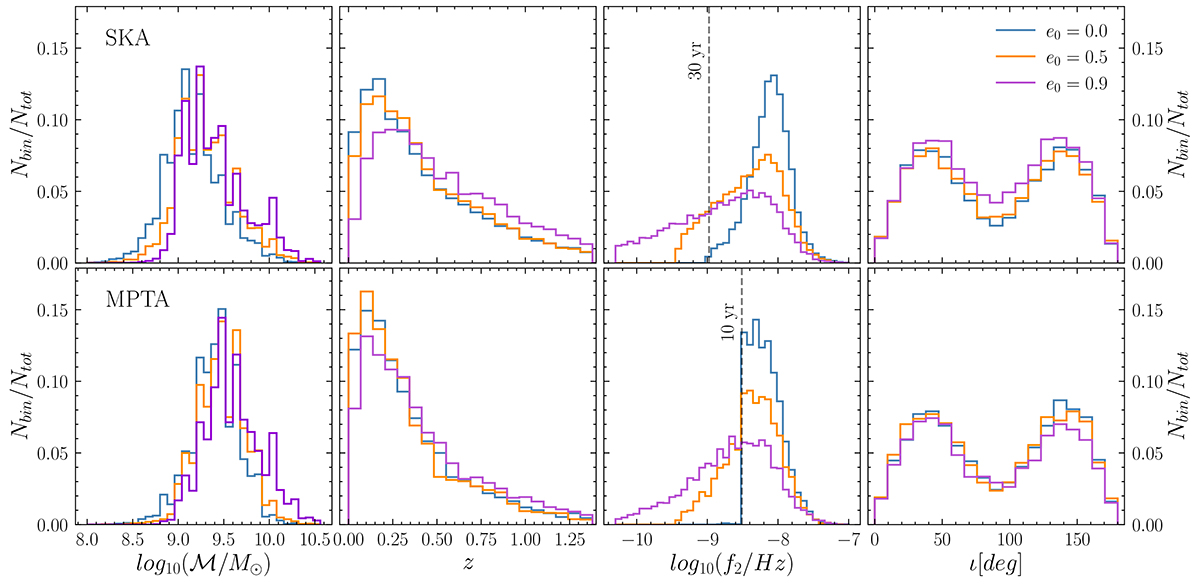
Chirp mass distribution (ℳ, upper left panel), redshift (z, upper right panel), twice the observed Keplerian frequency (f2, lower left panel), and inclination angle (i, lower right panel) of the detected MBHBs. Each color represents the distributions when different eccentricity values are used to evolve the MBHB population (e0 = 0, blue, e0 = 0.5, orange and e0 = 0.9 purple). NBin represents the number of objects in a given bin of the histogram while Ntot is the total number of objects analyzed. While the upper panels represent the results for 30-year SKA PTA, the lower ones correspond to 10-year MPTA.
Current usage metrics show cumulative count of Article Views (full-text article views including HTML views, PDF and ePub downloads, according to the available data) and Abstracts Views on Vision4Press platform.
Data correspond to usage on the plateform after 2015. The current usage metrics is available 48-96 hours after online publication and is updated daily on week days.
Initial download of the metrics may take a while.