Fig. 6.

Download original image
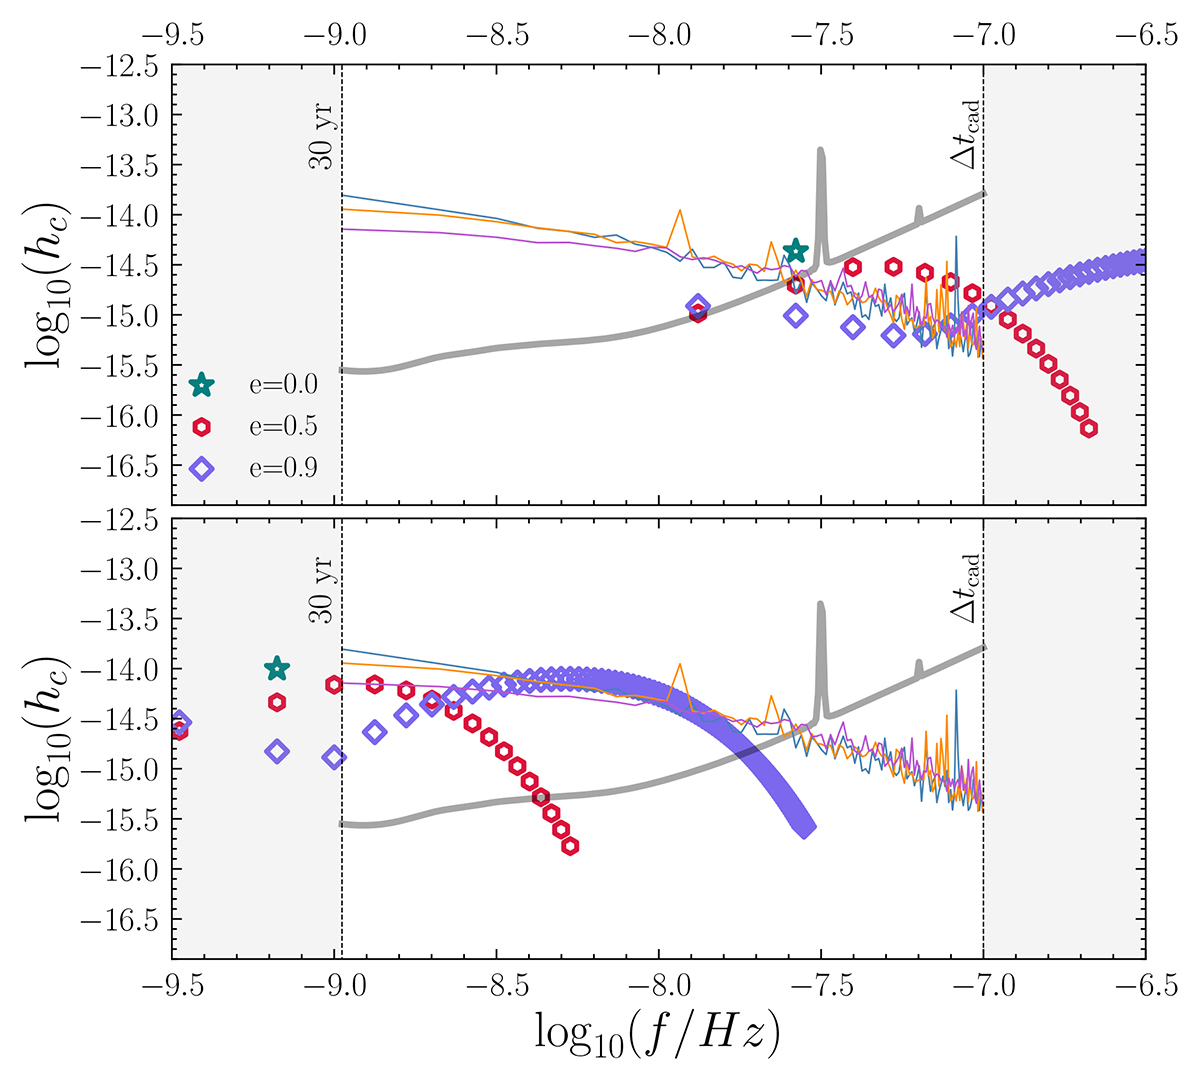
Characteristic strain (hc) as a function of observed frequency (f). The upper panel shows a binary with ℳ ∼ 108.5 M⊙ and the observed Keplerian frequency fk ∼ 10−8 Hz; while the lower panel shows a binary of ℳ ∼ 1010 M⊙ and fk ∼ 10−9.5 Hz outside the SKA PTA sensitivity curve. In each panel, blue, orange, and purple lines represent the root mean square of the sGWB generated by all the models with e0 = 0, 0.5 and 0.9, respectively. The black line corresponds to the sensitivity curve of SKA PTA (white and red noise) 30-year data. The colored dots represent how the signal of an MBHB is distributed across different frequencies when the eccentricity is varied between 0, 0.5 and 0.9.
Current usage metrics show cumulative count of Article Views (full-text article views including HTML views, PDF and ePub downloads, according to the available data) and Abstracts Views on Vision4Press platform.
Data correspond to usage on the plateform after 2015. The current usage metrics is available 48-96 hours after online publication and is updated daily on week days.
Initial download of the metrics may take a while.


