Fig. 5.
Download original image
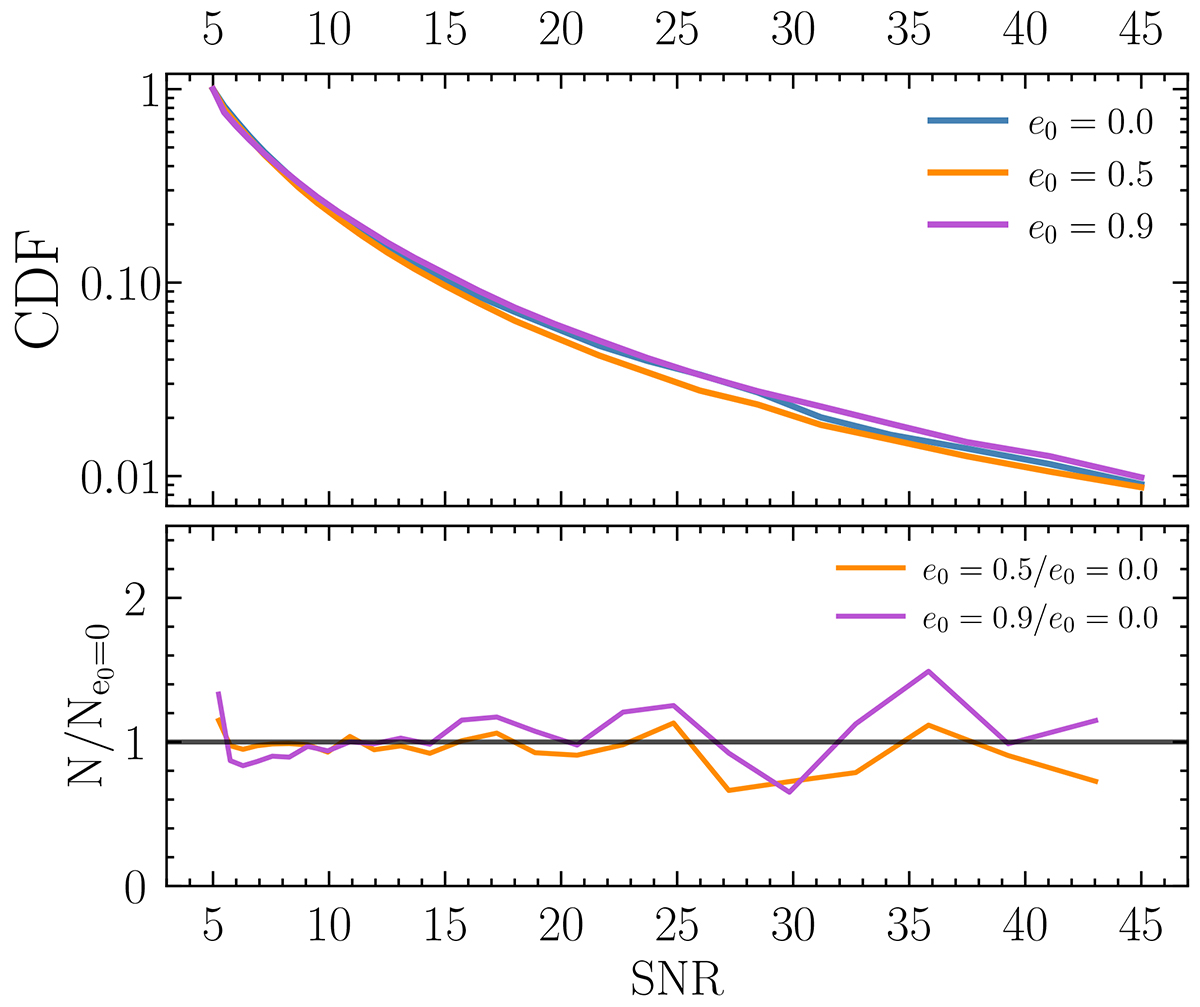
Cumulative distribution function (CDF) of the S/N featured by MBHBs detected by 30-year SKA PTA. Blue, orange, and purple curves represent the CDF of all the models generated with e0 = 0, 0.5 and 0.9, respectively. The lower panel presents the number of sources found with a given value of S/N for e0 = 0.5 and e0 = 0.9 models (orange and purple line) normalised with the same value found in the e0 = 0 case.
Current usage metrics show cumulative count of Article Views (full-text article views including HTML views, PDF and ePub downloads, according to the available data) and Abstracts Views on Vision4Press platform.
Data correspond to usage on the plateform after 2015. The current usage metrics is available 48-96 hours after online publication and is updated daily on week days.
Initial download of the metrics may take a while.