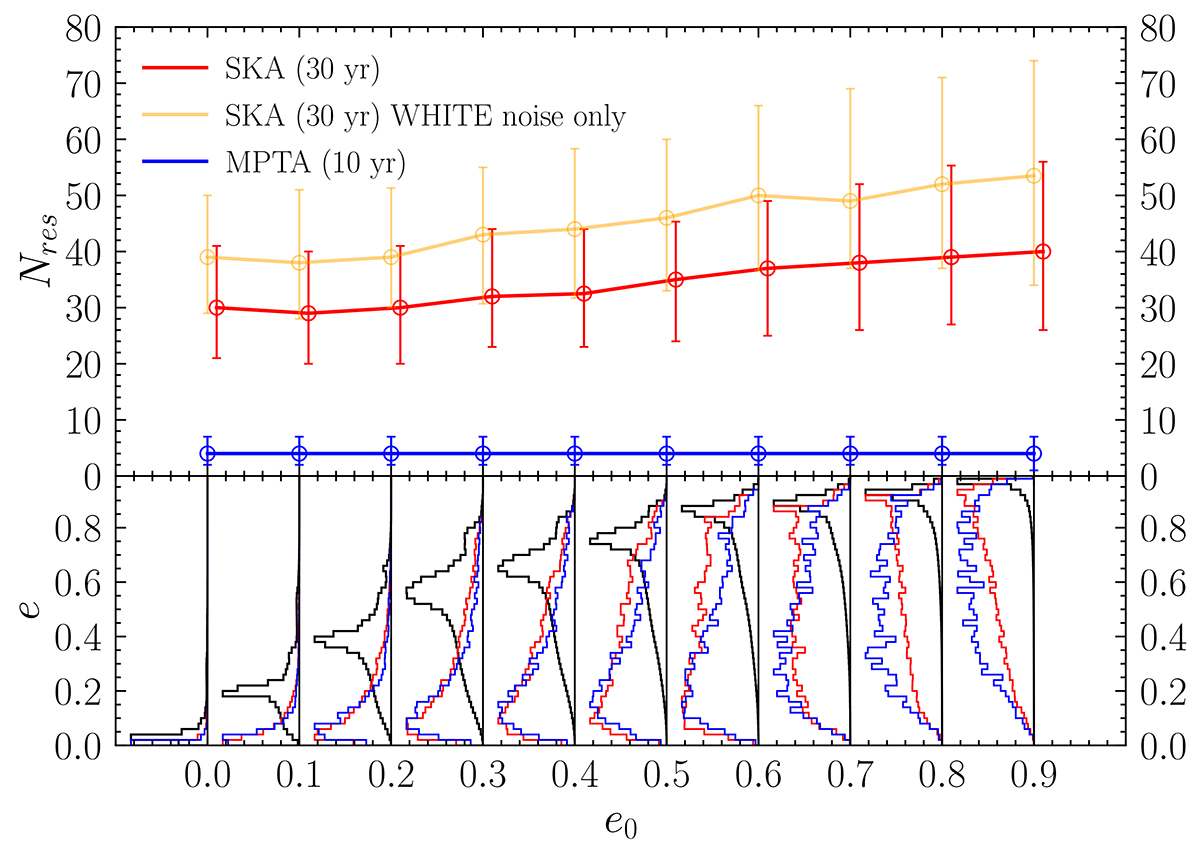
Fig. 4.
Download original image
Number of resolvable sources (Nres) for as a function of e0. Open dots represent median values from all the considered MBHB population models, while error bars represent the 84 and 16 percentile of the distribution. Blue points correspond to the results of 10-year MPTA data with S/N > 3, while the red ones represent the predictions for 30-year SKA data with S/N > 5. Orange points represent the 30-year SKA results but when accounting only for the white pulsar noise. The lower panel shows the eccentricity distribution of the whole MBHB population for different e0 models (black) and the eccentricity distribution of the MBHBs detectable as CGW sources (ers) for SKA PTA (red) and for MPTA (blue). We note that all the distributions are normalised to the same peak value for visualisation purposes.
Current usage metrics show cumulative count of Article Views (full-text article views including HTML views, PDF and ePub downloads, according to the available data) and Abstracts Views on Vision4Press platform.
Data correspond to usage on the plateform after 2015. The current usage metrics is available 48-96 hours after online publication and is updated daily on week days.
Initial download of the metrics may take a while.