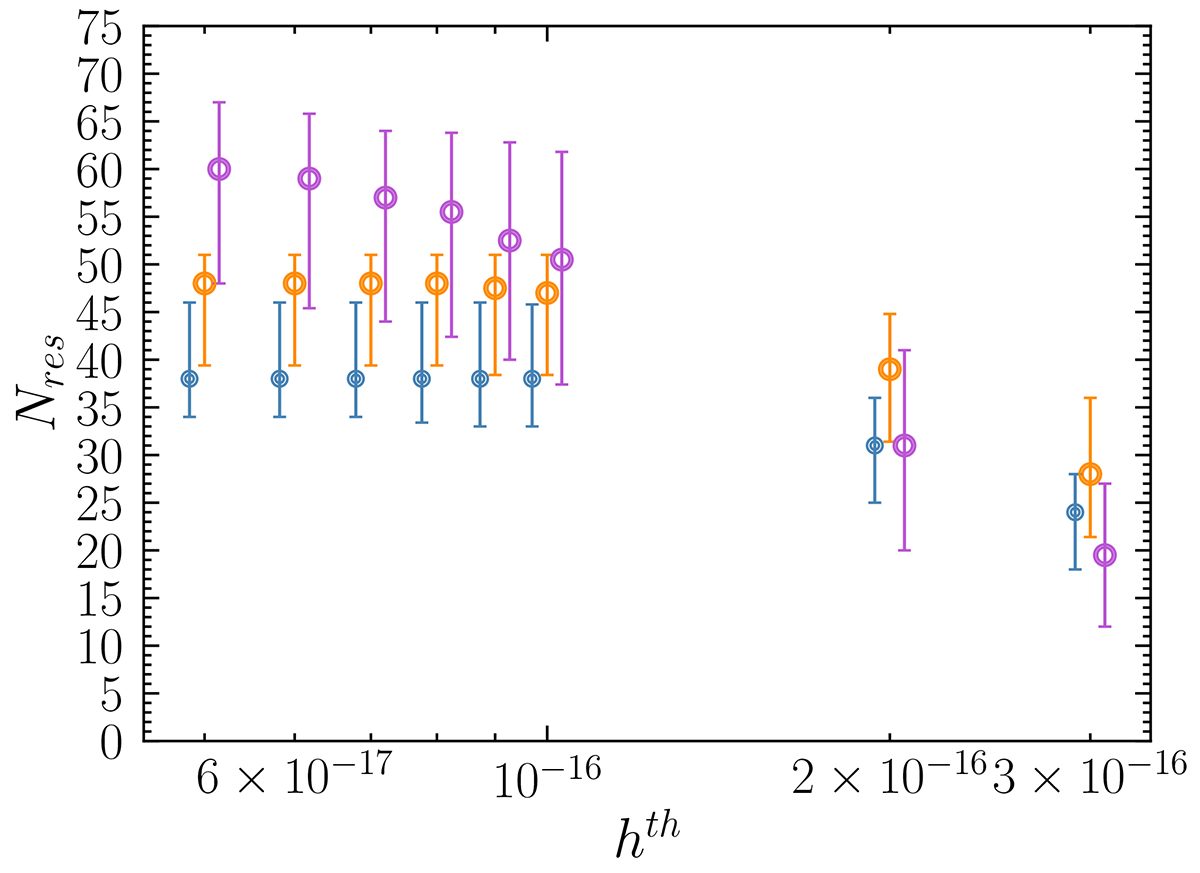
Fig. 3.
Download original image
Median number of resolvable sources of 96 randomly selected catalogs (Nres), with three diffented initial eccentricity, e0 = 0.0, e0 = 0.5, e0 = 0.9, as a function of the adopted thresholds in the GW signal amplitude (hth). Each set of marks and colors represents populations with different e0, as labeled in the figure. The values of Nres are computed by using the SKA PTA.
Current usage metrics show cumulative count of Article Views (full-text article views including HTML views, PDF and ePub downloads, according to the available data) and Abstracts Views on Vision4Press platform.
Data correspond to usage on the plateform after 2015. The current usage metrics is available 48-96 hours after online publication and is updated daily on week days.
Initial download of the metrics may take a while.