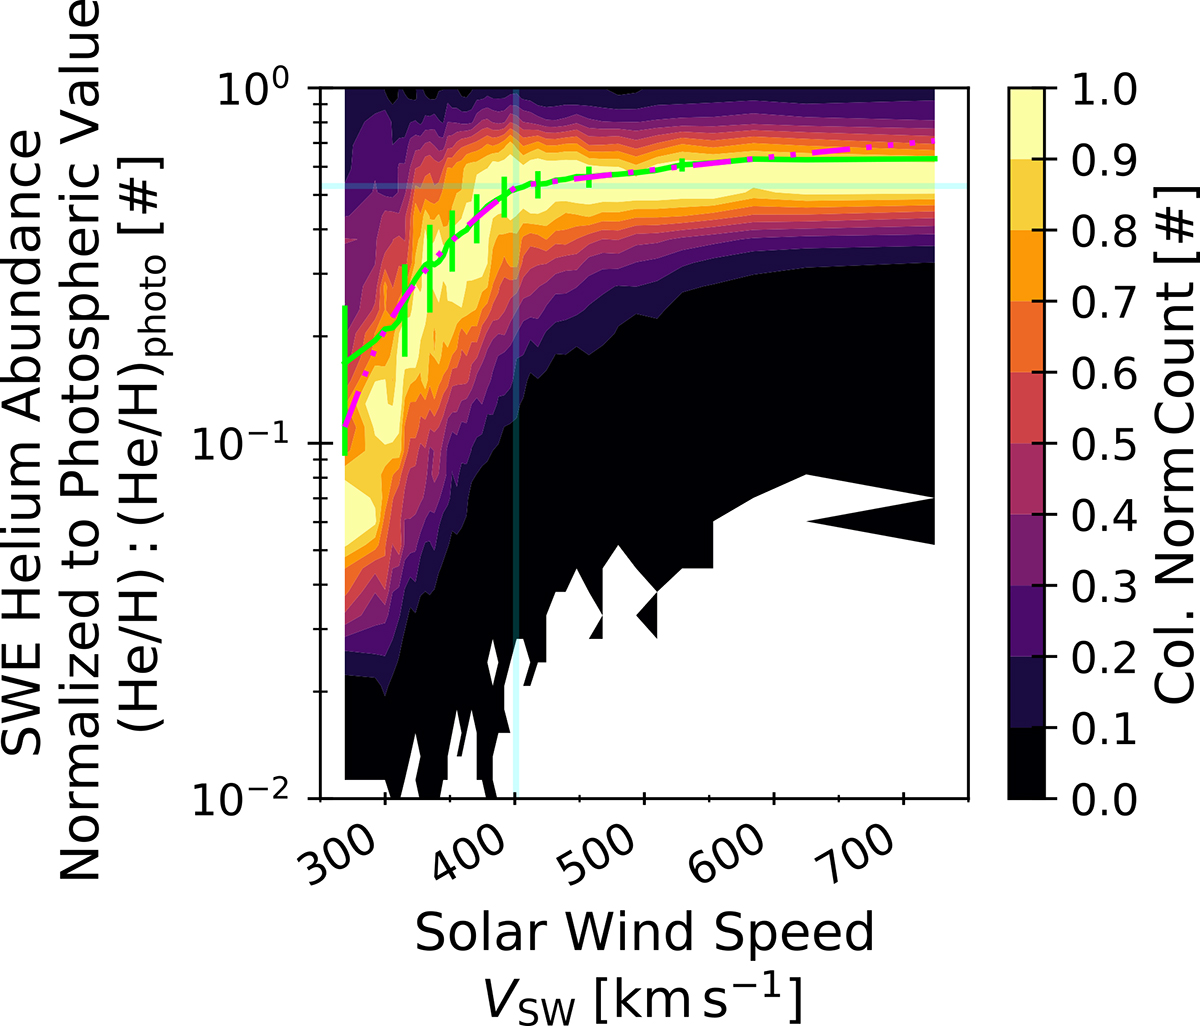
Fig. 1.
Download original image
Contour plot corresponding to a column-normalized 2D histogram of the SWE helium abundance as a function of the proton speed observed at Wind. The solid green line and error bars are the mean and standard deviation in each column. The dash-dotted pink line shows the result of a bilinear fit to the green line, where each line is selected as the minimum of both lines in the bilinear function over the full domain. Only speeds of vsw > 300 kms1 are included in the fit. Semitransparent blue lines indicate the saturation speed (vs) and saturation abundance (As) along with their uncertainties, where the bilinear function changes slope.
Current usage metrics show cumulative count of Article Views (full-text article views including HTML views, PDF and ePub downloads, according to the available data) and Abstracts Views on Vision4Press platform.
Data correspond to usage on the plateform after 2015. The current usage metrics is available 48-96 hours after online publication and is updated daily on week days.
Initial download of the metrics may take a while.