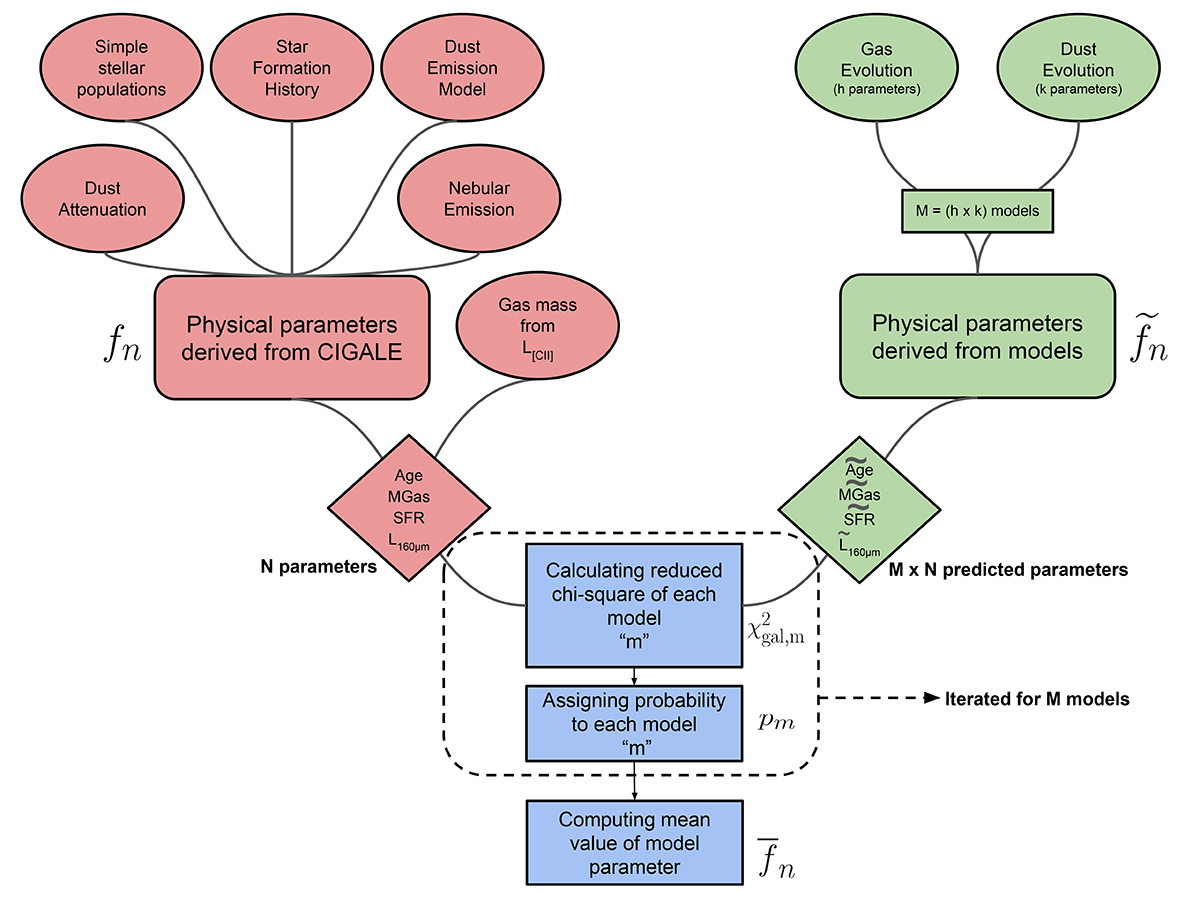
Fig. C.1.
Download original image
Visual representation of the fitting procedure presented in Sect. 3.5. The steps shaded in red denote the derivation of N physical parameters from SED fitting with CIGALE. The green steps denote the derivation of N predicted physical parameters from M chemical evolutionary models. The blue steps denote the statistical analysis used to derive the optimal value of our parameters.
Current usage metrics show cumulative count of Article Views (full-text article views including HTML views, PDF and ePub downloads, according to the available data) and Abstracts Views on Vision4Press platform.
Data correspond to usage on the plateform after 2015. The current usage metrics is available 48-96 hours after online publication and is updated daily on week days.
Initial download of the metrics may take a while.