Fig. 6.
Download original image
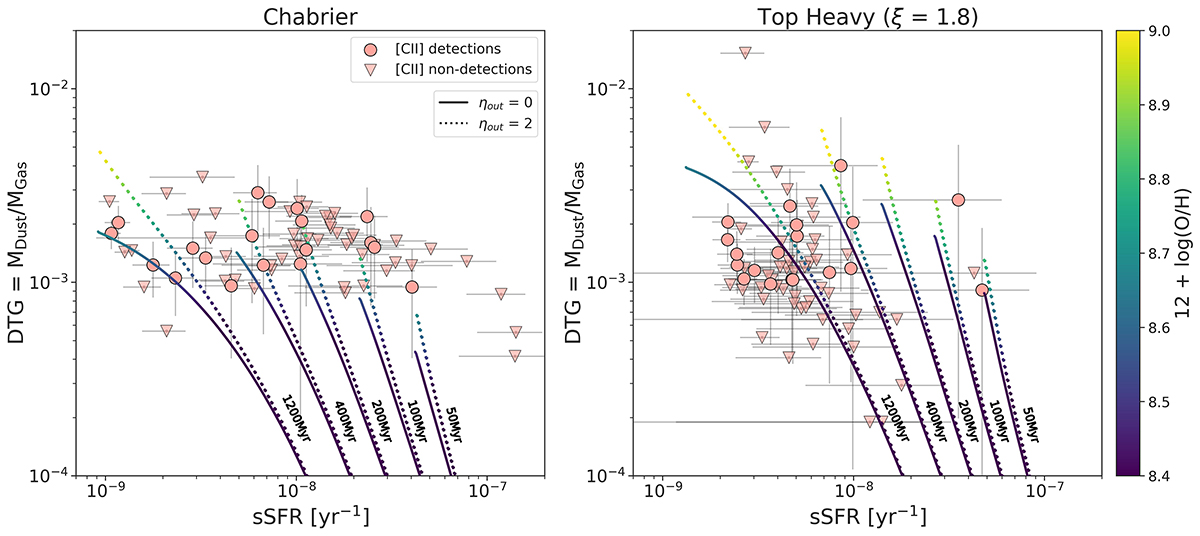
Dust-to-gas ratio plotted against sSFR for the ALPINE galaxies assuming a Chabrier IMF (left) and a THIMF (right). Only galaxies with [CII] detections are shown. The circles represent galaxies with detected dust continuum, while the upper limits on the dust mass are indicated by inverse triangles. The evolutionary models are plotted assuming [MGas, ini, ηout, ηin, ϵSN] ∼ [3.3, 0−2, 0.6, 0.1] and [4.4, 0−2, 0.6, 0.1] for Chabrier and THIMF, respectively. The models are color-coded by predicted metallicity and illustrate the impact of varying the ηout from 0 (solid curves) to 2 (dotted curves).
Current usage metrics show cumulative count of Article Views (full-text article views including HTML views, PDF and ePub downloads, according to the available data) and Abstracts Views on Vision4Press platform.
Data correspond to usage on the plateform after 2015. The current usage metrics is available 48-96 hours after online publication and is updated daily on week days.
Initial download of the metrics may take a while.