Fig. 5.
Download original image
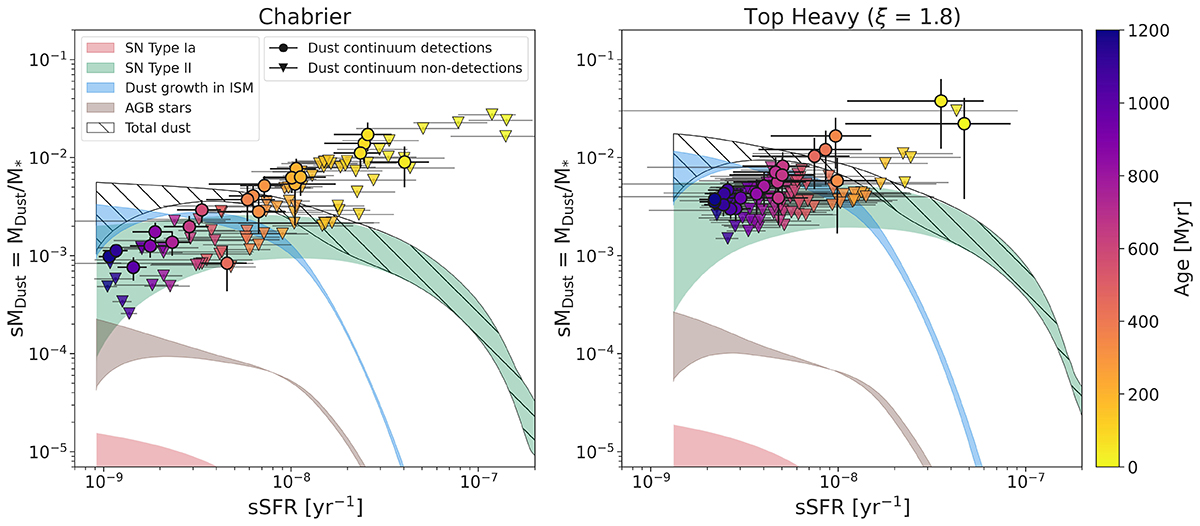
sMDust plotted against sSFR for the ALPINE galaxies assuming a Chabrier IMF (left) and THIMF (right). The circles represent galaxies with detected continuum emission, while the inverse triangles mark the upper limits on dust mass. The contributions from the various dust sources are distinguished by the different identifiers. The mass-loading factor ranges from 0 to 2. The overall dust evolution track, which includes all contributions, is shown for the constrained parameters [MGas, ini, ηout, ηin, ϵSN] ∼ [3.3, 0−2, 0.6, 0.1] and [4.4, 0−2, 0.6, 0.1] for the Chabrier and THIMF cases, respectively, at an age ∼ 1200 Myr (hatched region). The green, pink, and brown patches represent contributions from SNII, SNIa, and AGB stars, respectively. For SNII and SNIa, the models range from 25% dust condensation with ηout = 0, to 100% condensation with ηout = 2. For AGB stars, the models vary with ηout from 0 to 2. The blue patch shows the contribution of ISM growth to the total dust content, assuming a growth efficiency of 1, varying with ηout from 0 to 2. The galaxies are color-coded based on the age of their main stellar population.
Current usage metrics show cumulative count of Article Views (full-text article views including HTML views, PDF and ePub downloads, according to the available data) and Abstracts Views on Vision4Press platform.
Data correspond to usage on the plateform after 2015. The current usage metrics is available 48-96 hours after online publication and is updated daily on week days.
Initial download of the metrics may take a while.