Fig. C.4
Download original image
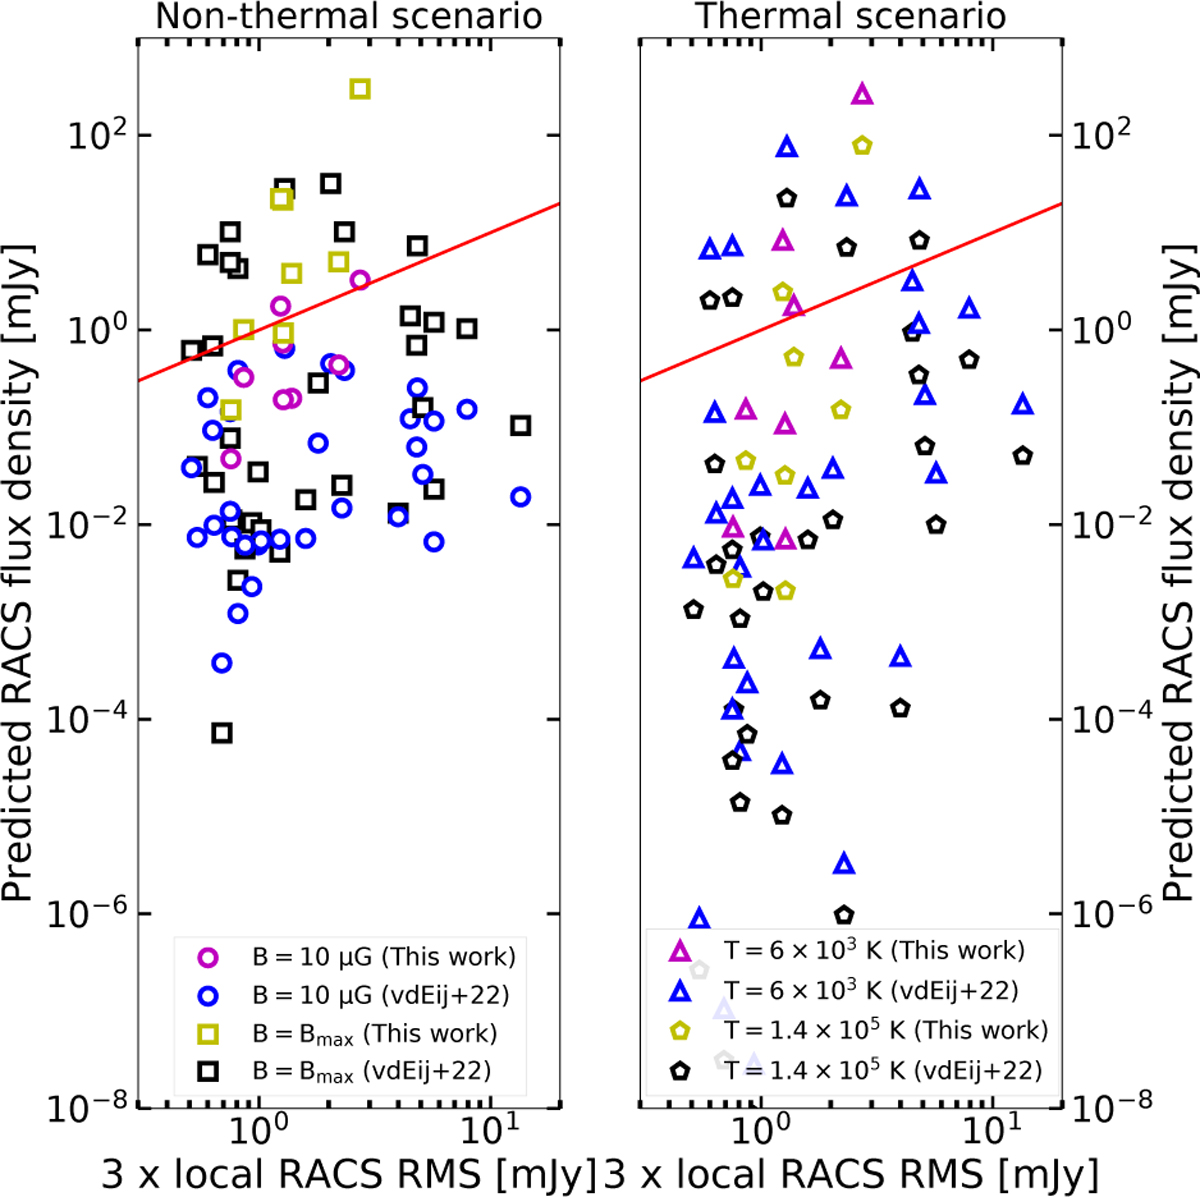
Predicted peak radio flux density as a function of three times the local RMS for the nonthermal (left) and thermal (right) scenarios. This plot contains the original data presented in van den Eijnden et al. (2022b), and our sources in yellow and magenta colors, with different symbols depending on the scenario conditions. The one-to-one line is shown by the red line; sources above it should, at minimum, have observable emission in a single beam.
Current usage metrics show cumulative count of Article Views (full-text article views including HTML views, PDF and ePub downloads, according to the available data) and Abstracts Views on Vision4Press platform.
Data correspond to usage on the plateform after 2015. The current usage metrics is available 48-96 hours after online publication and is updated daily on week days.
Initial download of the metrics may take a while.