Open Access
Fig. 8
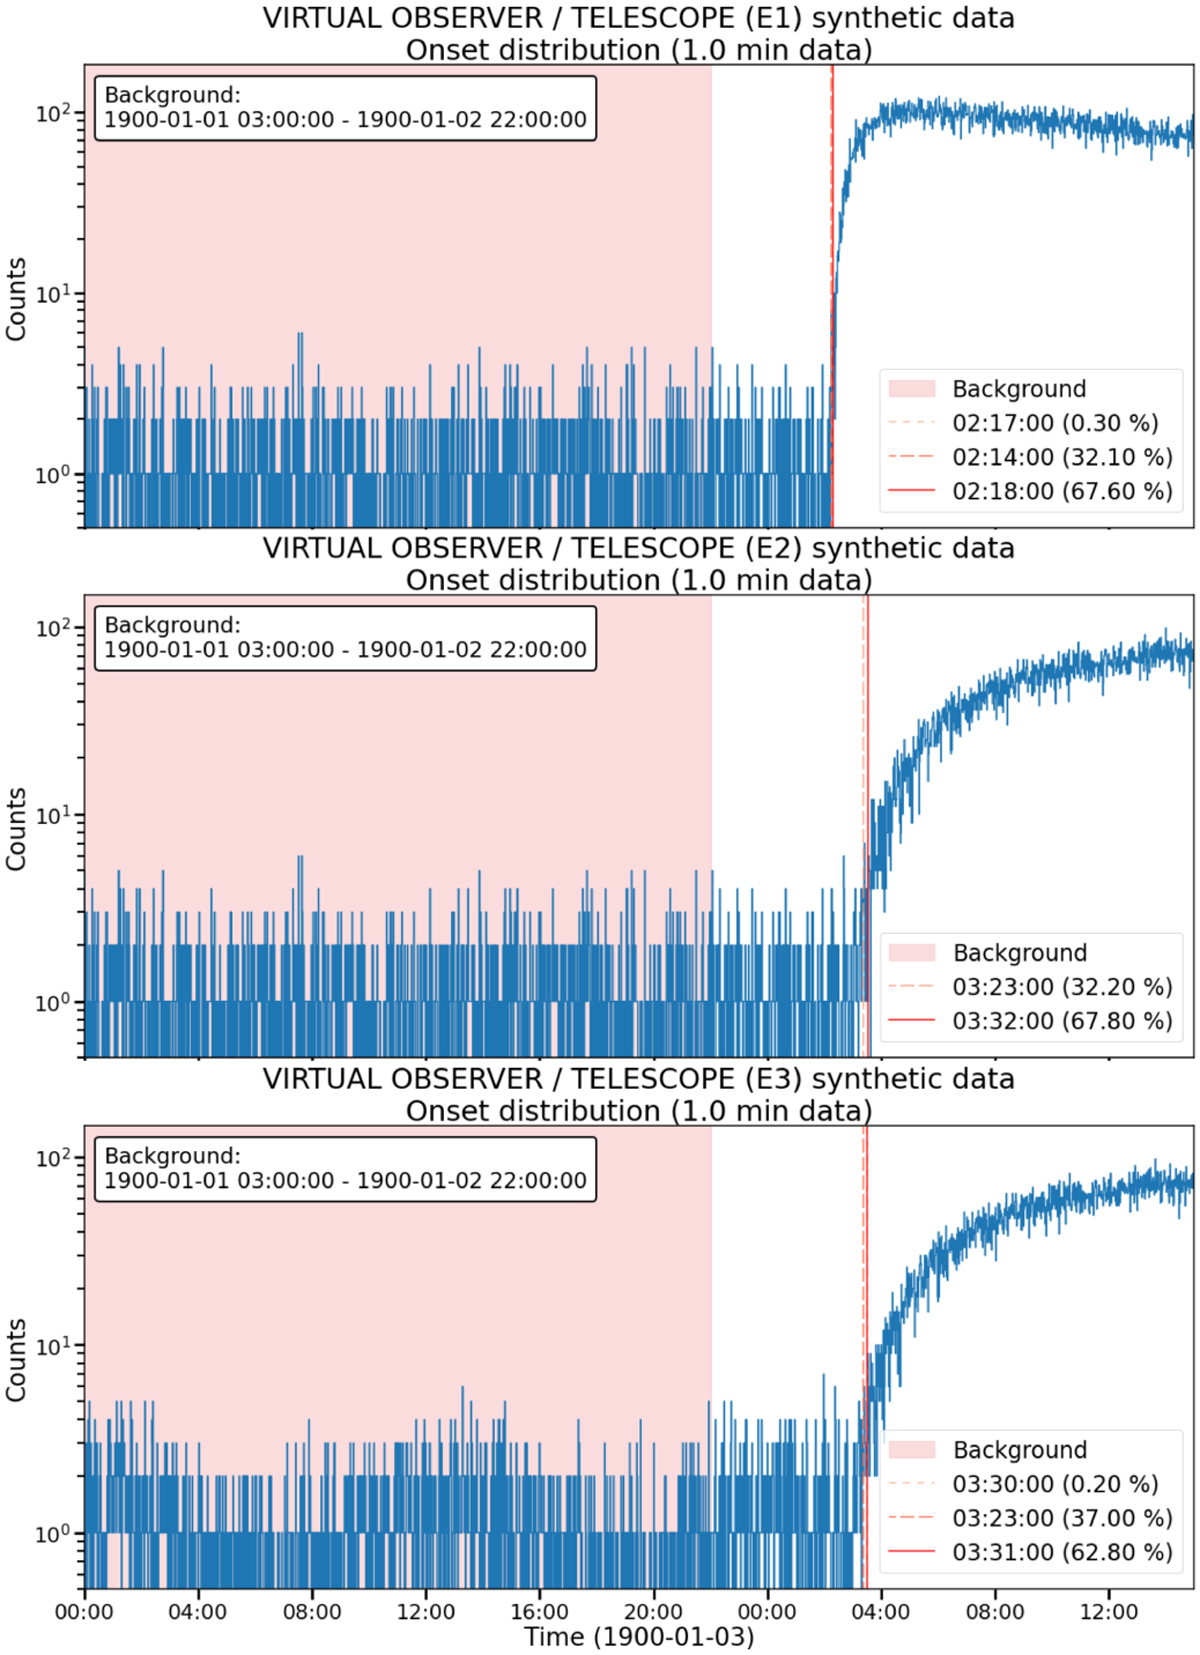
Download original image
Three simulated SEP events and the onset analysis results of the hybrid method for the base cadence (one minute). The most probable onset time in base cadence (solid vertical red line) in each panel is also the onset time found by the classical Poisson-CUSUM.
Current usage metrics show cumulative count of Article Views (full-text article views including HTML views, PDF and ePub downloads, according to the available data) and Abstracts Views on Vision4Press platform.
Data correspond to usage on the plateform after 2015. The current usage metrics is available 48-96 hours after online publication and is updated daily on week days.
Initial download of the metrics may take a while.