Fig. A.2
Download original image
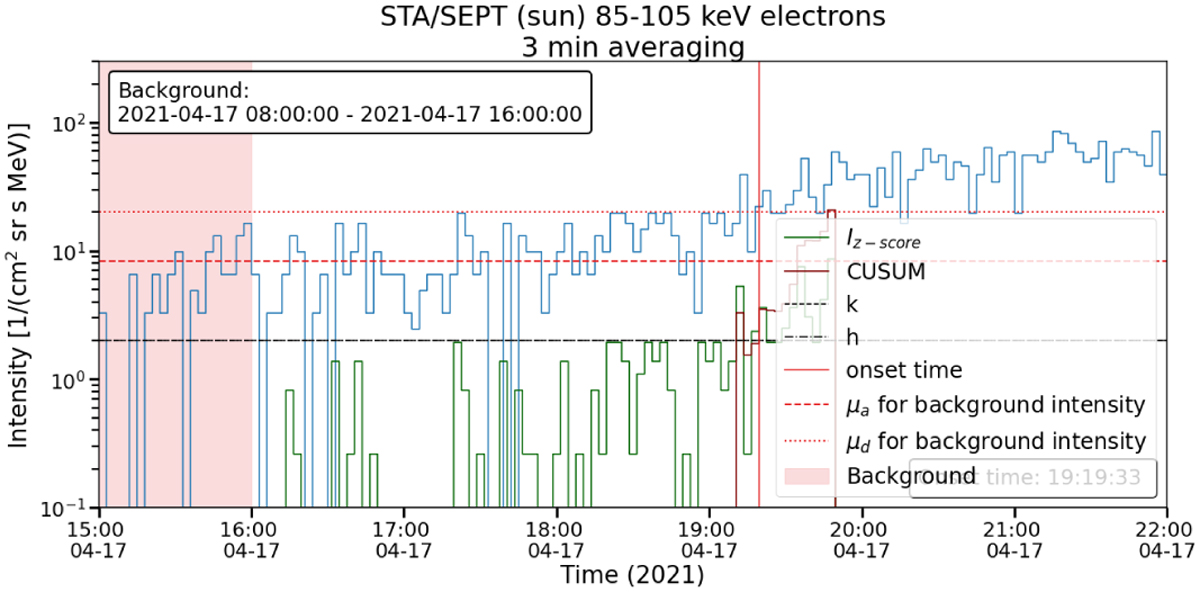
Onset diagnostics for the 3-minute time-averaged data of STEREO-A / SEPT 85–105 keV electrons on the 2021-04-17 SEP event. The corresponding onset time plot is displayed in Fig. 1. The figure shows the CUSUM function (dark red curve) along with its arguments: z-standardized intensity (green), k (dashed black line), and h (dash- dotted black line). The figure also shows, just like the standard plot without diagnostics, the mean of the background (horizontal dashed red line) and the µ + nσ line, where n = 2 (horizontal dotted red line).
Current usage metrics show cumulative count of Article Views (full-text article views including HTML views, PDF and ePub downloads, according to the available data) and Abstracts Views on Vision4Press platform.
Data correspond to usage on the plateform after 2015. The current usage metrics is available 48-96 hours after online publication and is updated daily on week days.
Initial download of the metrics may take a while.