Fig. A.1
Download original image
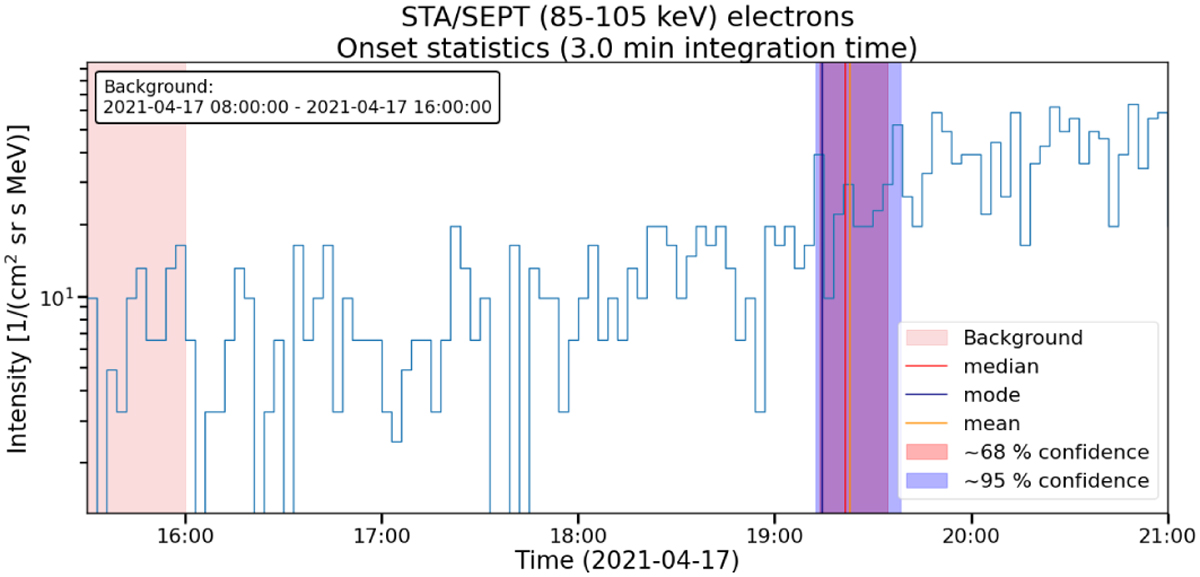
Distribution statistics for the 3-minute time-averaged data of STEREO-A / SEPT 85–105 keV electrons on the 2021-04-17 SEP event. The corresponding onset times are displayed on top of the time series in Fig. 3 and as a histogram in Fig. 4. The figure here shows the median (red), mode (blue) and the mean (orange) of the distribution as vertical lines and the ∼68 % (purple) and ∼95 % (blue) confidence intervals of the distribution as shadings. The chosen background for the method is seen on the left of the figure as light red shading.
Current usage metrics show cumulative count of Article Views (full-text article views including HTML views, PDF and ePub downloads, according to the available data) and Abstracts Views on Vision4Press platform.
Data correspond to usage on the plateform after 2015. The current usage metrics is available 48-96 hours after online publication and is updated daily on week days.
Initial download of the metrics may take a while.