Fig. 8.
Download original image
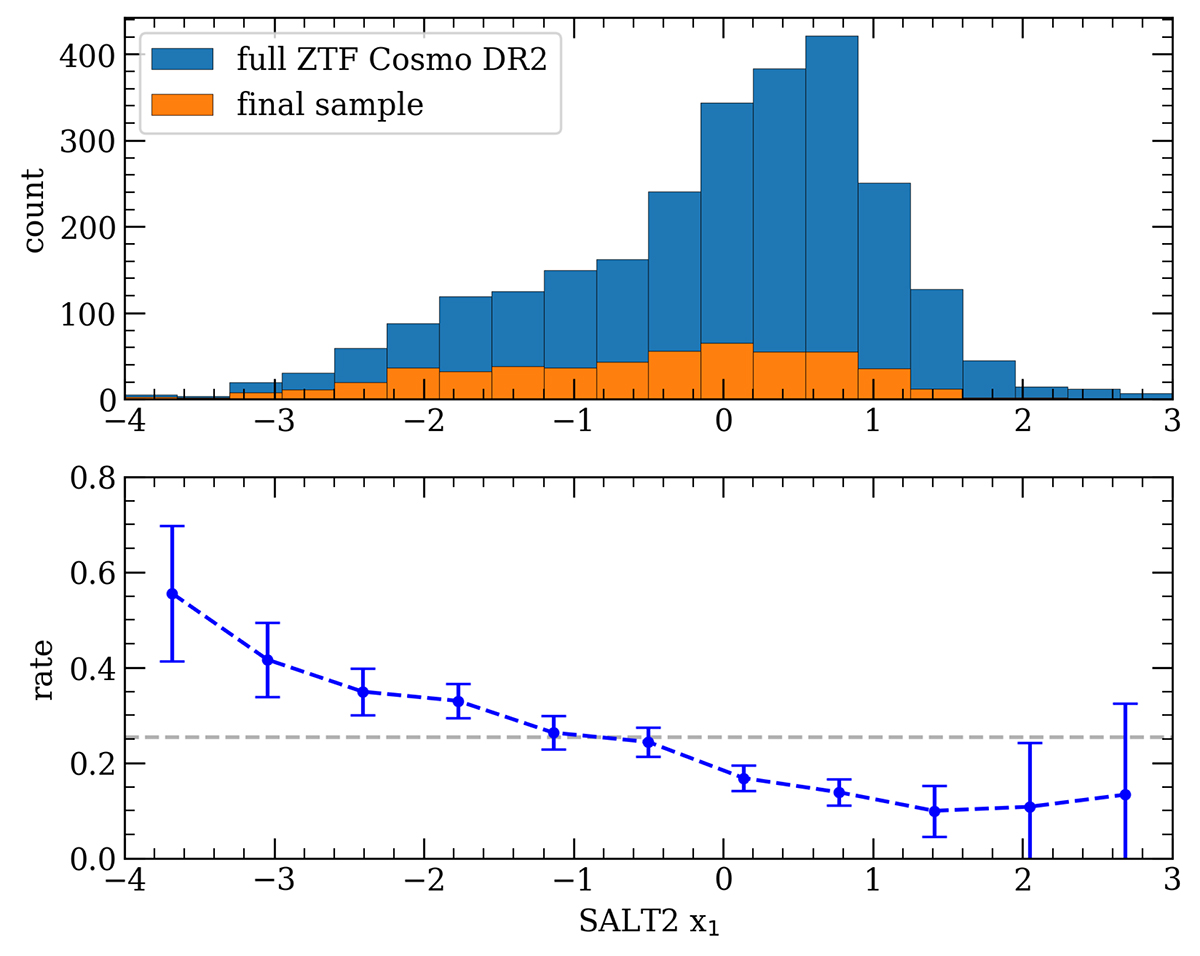
SALT2 x1 completeness of the final galaxy sample. Top panel: Blue histogram shows the ZTF DR2 binned in SALT2 x1, with the light curve quality cuts applied, see Sect. 2.3. The orange histogram shows the final sample containing SNe Ia with successfully fitted galaxy models. Bottom panel: Rate of finding a SN Ia with any particular x1 value in the final sample. The dashed grey line shows the average rate.
Current usage metrics show cumulative count of Article Views (full-text article views including HTML views, PDF and ePub downloads, according to the available data) and Abstracts Views on Vision4Press platform.
Data correspond to usage on the plateform after 2015. The current usage metrics is available 48-96 hours after online publication and is updated daily on week days.
Initial download of the metrics may take a while.