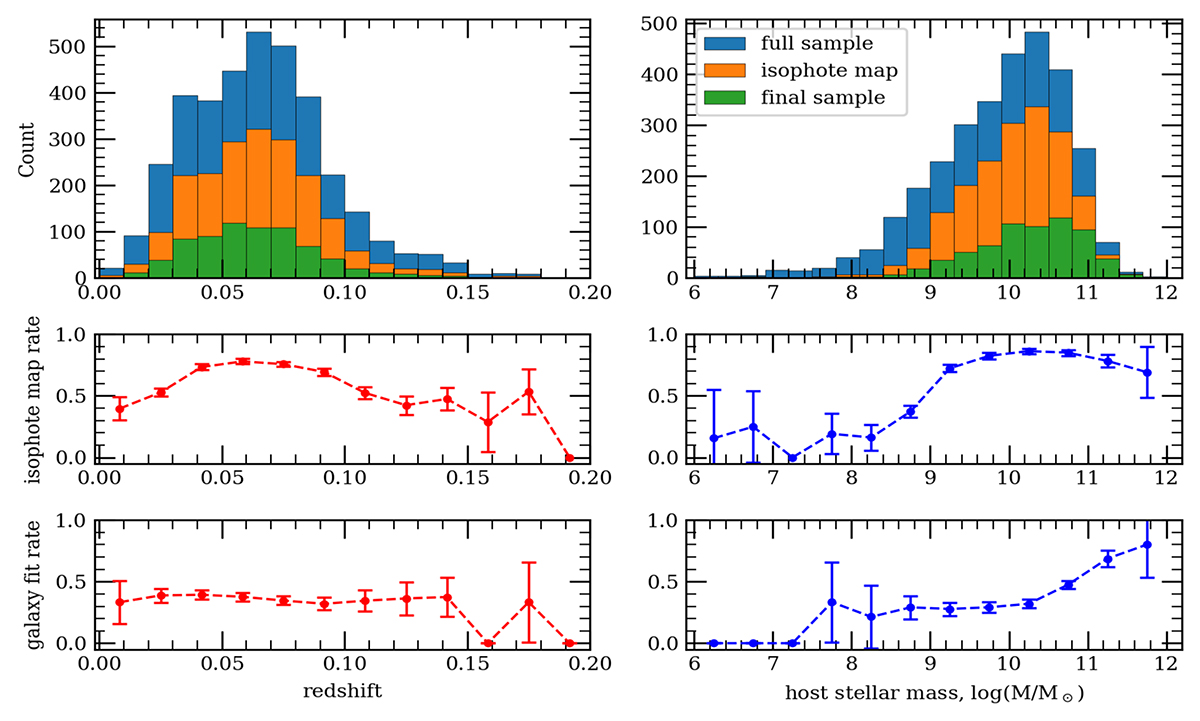
Fig. 7.
Download original image
Fit success rate as a function of redshift and host mass. Top panels: Blue histogram shows the full ZTF Cosmo DR2 binned in redshift (left) and host mass (right). Orange histogram shows galaxies with isophote maps that pass all quality cuts. Green histogram shows final sample (successful galaxy fit + galaxy morphology identified). Centre panels: Success rate for generating a successful isophote map, given a galaxy image, as a function of redshift (left) and host mass (right). Bottom panels: Success rate for generating a galaxy model (successful galaxy fit + galaxy morphology identified), given an isophote map, as a function of redshift (left) and host mass (right).
Current usage metrics show cumulative count of Article Views (full-text article views including HTML views, PDF and ePub downloads, according to the available data) and Abstracts Views on Vision4Press platform.
Data correspond to usage on the plateform after 2015. The current usage metrics is available 48-96 hours after online publication and is updated daily on week days.
Initial download of the metrics may take a while.