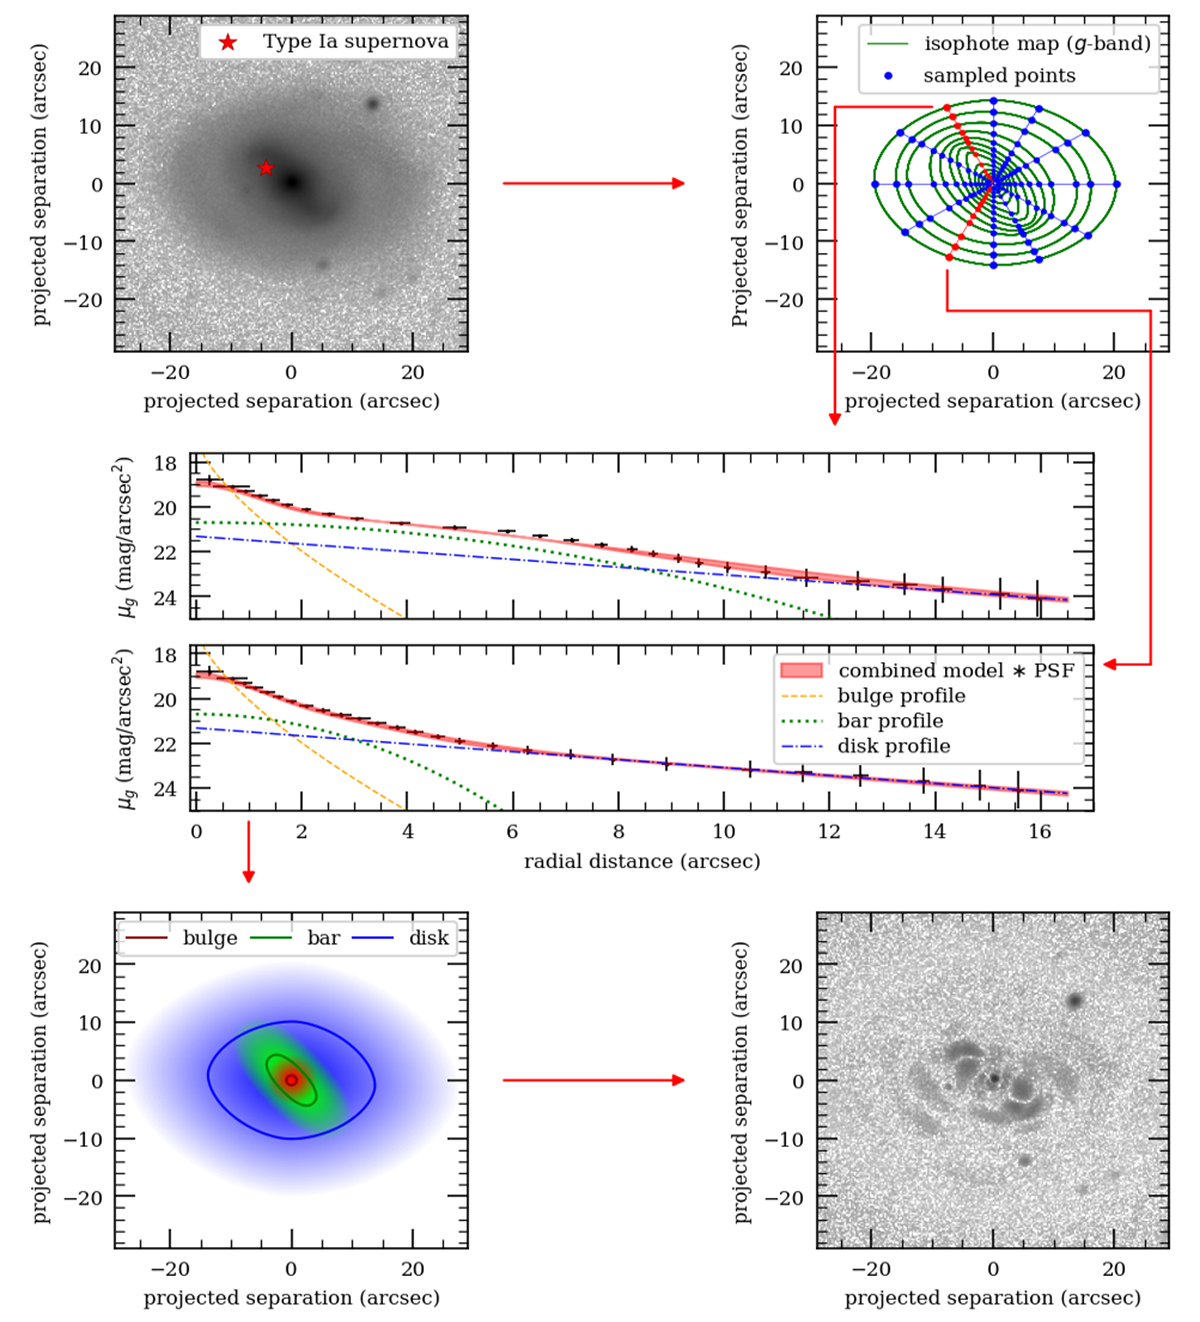
Fig. 4.
Download original image
Schematic showing the main steps of the galaxy fitting procedure. Top left: DESI-LS image of a barred host galaxy, containing a ZTF SN Ia. Top right: The green superellipses are the isophotes of the constructed g-band isophote map (every second isophote has been removed for visual clarity). The blue dots mark the sampled points used during the galaxy fitting. Middle panels: Two example fitted surface brightness profiles are shown. The first panel is located at 120°, close to the semi-major axis of the bar, while the second panel is located at 240°, close to the semi-minor axis of the bar. The black points correspond to the sampled blue dots from the top right panel, with 3σ error bars. The coloured lines (orange, green and red) represent the fitted intrinsic profiles for each component in the ‘Bulge+Bar+Disc’ model. The shaded red region shows the 3σ confidence interval for the combined model, convolved with the PSF. Bottom left: The reconstructed 2D surface brightness model of the galaxy, convolved with the PSF. The three superellipses represent the intrinsic effective radius for each component in the model. The shaded regions are computed by linearly mapping the surface brightness profile to the opacity. The central brightness has an opacity of one, while zero opacity is at the 25 mag/arcsec2 isophote. Bottom right: Subtraction of model from original image in surface brightness space.
Current usage metrics show cumulative count of Article Views (full-text article views including HTML views, PDF and ePub downloads, according to the available data) and Abstracts Views on Vision4Press platform.
Data correspond to usage on the plateform after 2015. The current usage metrics is available 48-96 hours after online publication and is updated daily on week days.
Initial download of the metrics may take a while.