Fig. 11.
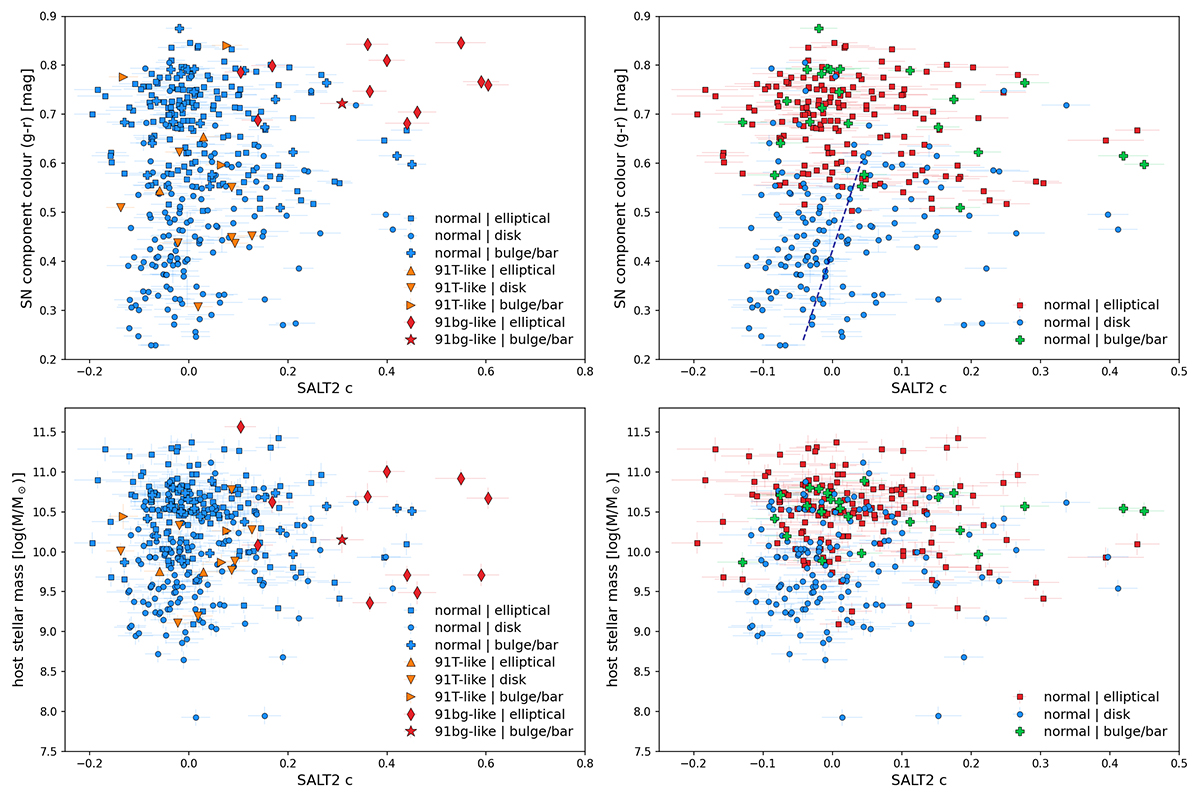
Download original image
Galaxy colour and host mass versus SALT2 c. The top panels show SN-component-colour (Sect. 4.9) versus c, while the bottom panels show host stellar mass versus c. The left panels show the distribution of normal SNe Ia (blue circles), ‘91bg-like’ SNe Ia (red diamonds), and ‘91T-like’ SNe Ia (orange triangles). The right panels contain only the normal SNe Ia, with the associated galaxy component highlighted (Sect. 4.8). A Weighted linear regression (dashed blue line) is shown for SN-component-colour and c in disc galaxies.
Current usage metrics show cumulative count of Article Views (full-text article views including HTML views, PDF and ePub downloads, according to the available data) and Abstracts Views on Vision4Press platform.
Data correspond to usage on the plateform after 2015. The current usage metrics is available 48-96 hours after online publication and is updated daily on week days.
Initial download of the metrics may take a while.