Fig. 7.
Download original image
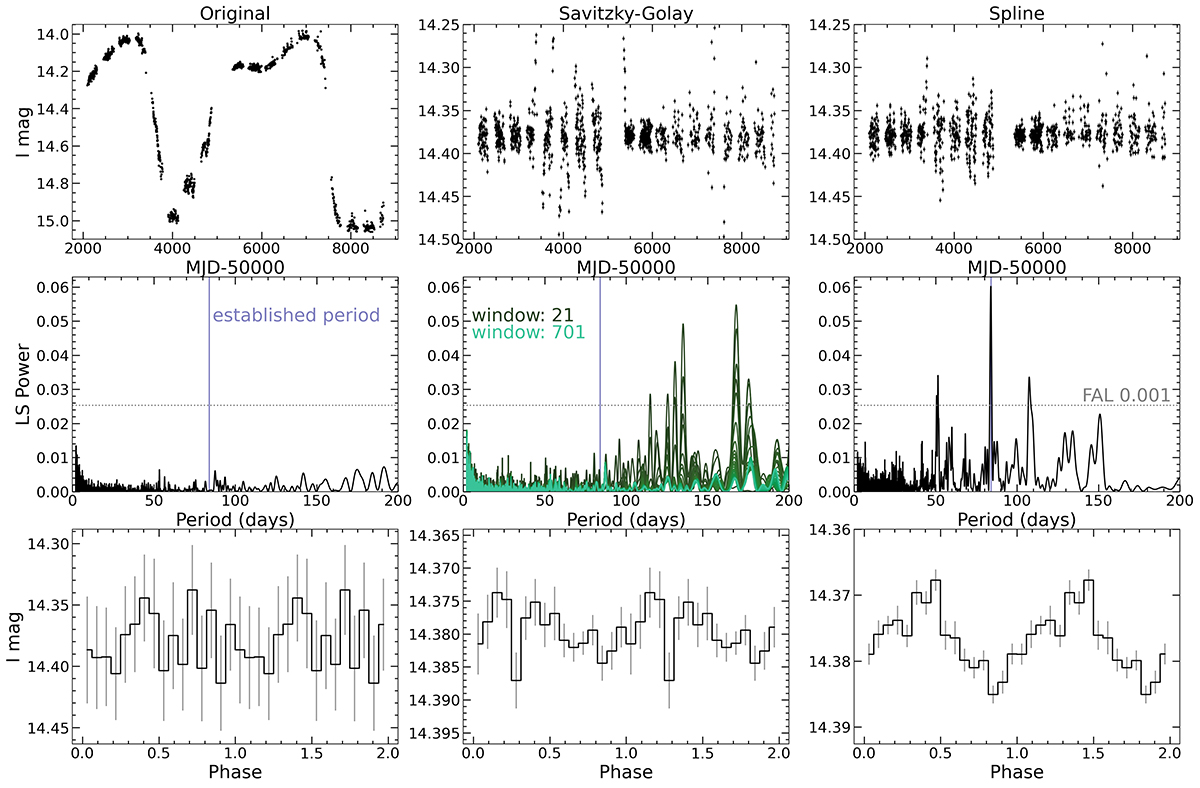
Demonstration of the utility of spline detrending for periodicity searches. The top row includes I magnitude light curves for Source #2 (SXP 2.16), with the middle column using Savitzy-Golay detrending, and the right using spline detrending with wotan (Hippke et al. 2019). The corresponding periodograms and phase-folded data are shown below these light curves, with the established period from HS16 used in each. We show the Savitzky-Golay detrending using a window of 21 for the light curve and phase-folded data. As noted in Sect. 5.1, this value is also consistent with X-ray observations of the orbital period. The gray dotted line marks the false alarm level of 0.001.
Current usage metrics show cumulative count of Article Views (full-text article views including HTML views, PDF and ePub downloads, according to the available data) and Abstracts Views on Vision4Press platform.
Data correspond to usage on the plateform after 2015. The current usage metrics is available 48-96 hours after online publication and is updated daily on week days.
Initial download of the metrics may take a while.