Fig. 6.
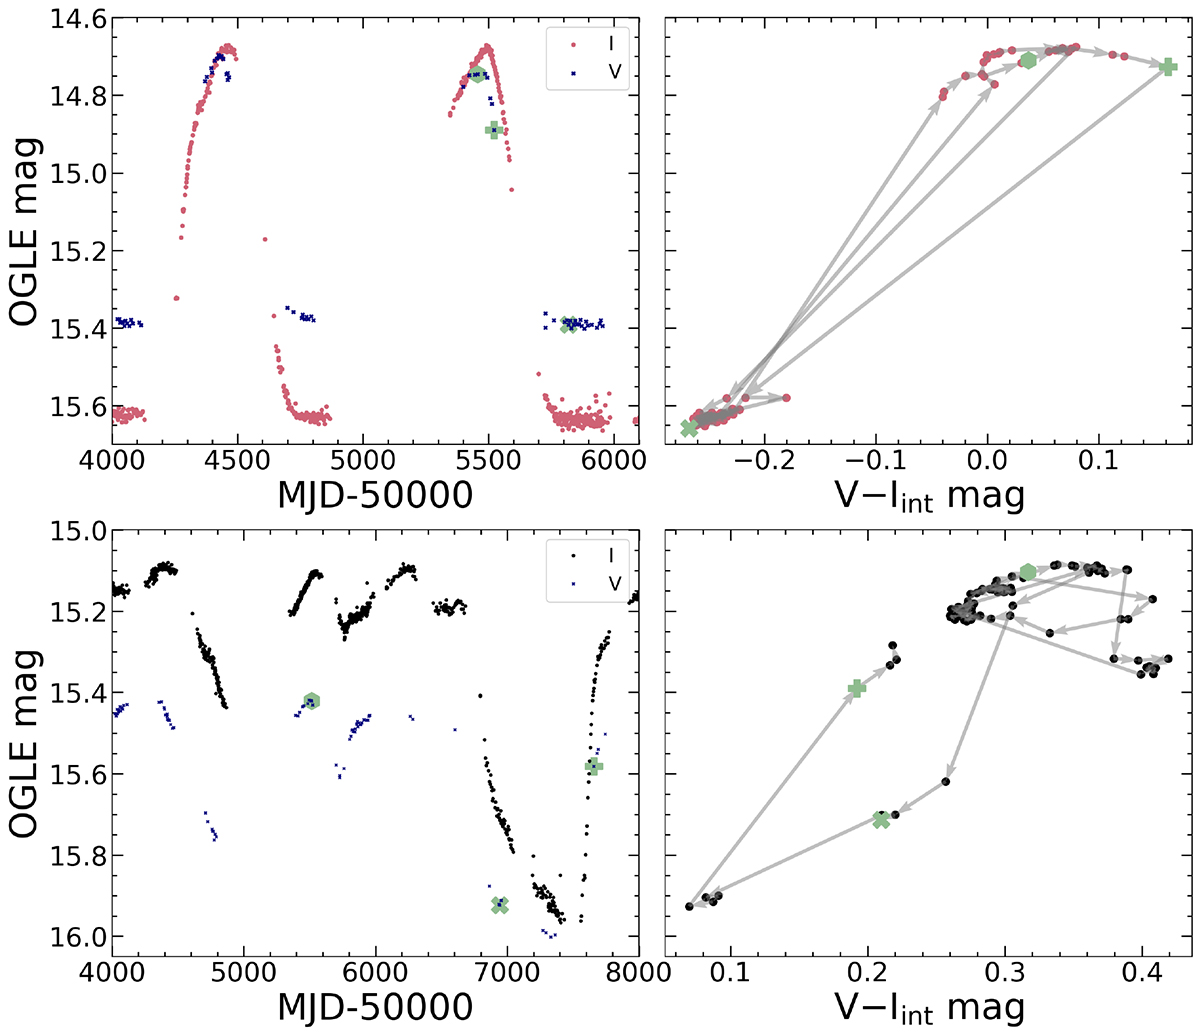
Download original image
Examples of looping behavior for Type 1 and 2 sources. Top: Two peaks of a representative Type 1 light curve (Source #103), with the corresponding color-magnitude behavior shown on the right. The larger green points highlight the correspondence between the two plots at three key stages of the light curve evolution. Bottom: Partial Type 2 light curve of Source #75 with the corresponding part of the source’s CMD on the right.
Current usage metrics show cumulative count of Article Views (full-text article views including HTML views, PDF and ePub downloads, according to the available data) and Abstracts Views on Vision4Press platform.
Data correspond to usage on the plateform after 2015. The current usage metrics is available 48-96 hours after online publication and is updated daily on week days.
Initial download of the metrics may take a while.