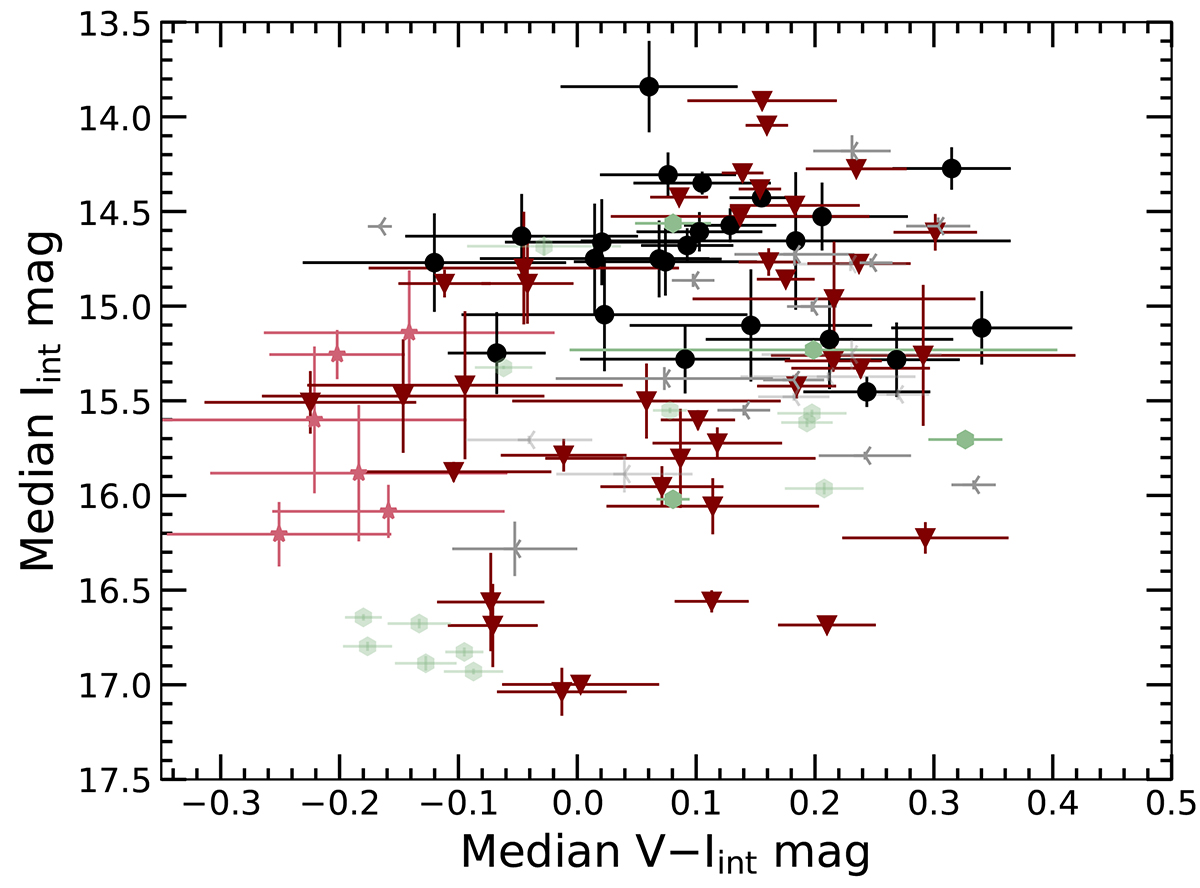
Fig. 3.
Download original image
Color-magnitude diagram for all sources with types distinguished as they are in Fig. 1. Median light curve I and V − I magnitudes are used, with error bars representing the standard deviation of each. Translucent points indicate that the corresponding source required manual calibration of OGLE epochs, entailing an additional source of uncertainty in both axes. We exclude sources 1, 48, 73 and 92, due to their limited overlap in I- and V-band coverage. For eight sources (Sources 63, 74, 77, 79, 86, 88, 91, and 98), there appear to be unphysical measurements during OGLE-II, so these measurements are excluded from the distributions.
Current usage metrics show cumulative count of Article Views (full-text article views including HTML views, PDF and ePub downloads, according to the available data) and Abstracts Views on Vision4Press platform.
Data correspond to usage on the plateform after 2015. The current usage metrics is available 48-96 hours after online publication and is updated daily on week days.
Initial download of the metrics may take a while.