Fig. 13.
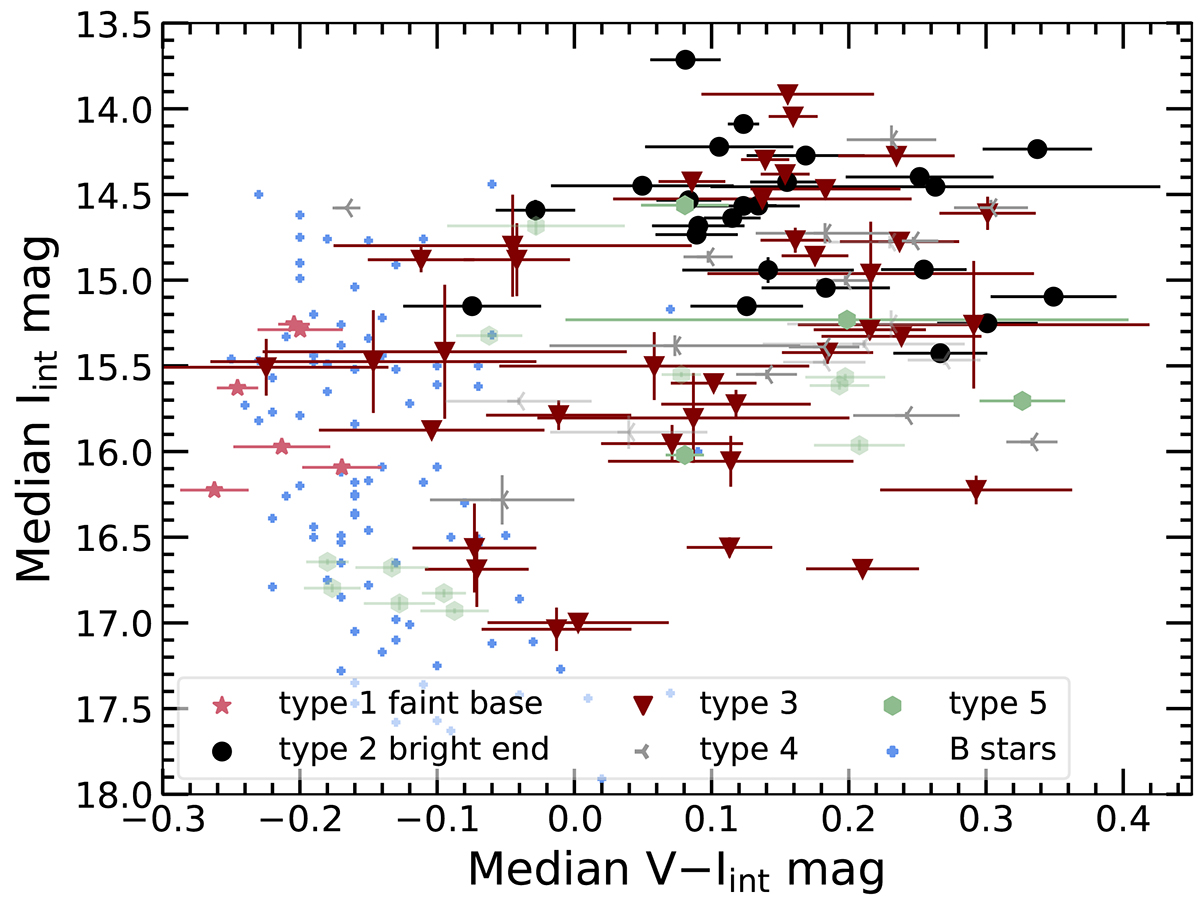
Download original image
Color-magnitude diagram for the bases of Types 1 and 2 and for entire Type 3, 4, and 5 light curves. Light blue points indicate SMC B stars in the Kourniotis et al. (2014) sample. For sources in our sample, error bars show one standard deviation in each axis for the given full light curve or base. Translucent points indicate that the corresponding source required manual calibration of OGLE epochs, entailing an additional source of uncertainty in both axes.
Current usage metrics show cumulative count of Article Views (full-text article views including HTML views, PDF and ePub downloads, according to the available data) and Abstracts Views on Vision4Press platform.
Data correspond to usage on the plateform after 2015. The current usage metrics is available 48-96 hours after online publication and is updated daily on week days.
Initial download of the metrics may take a while.