Fig. 12.
Download original image
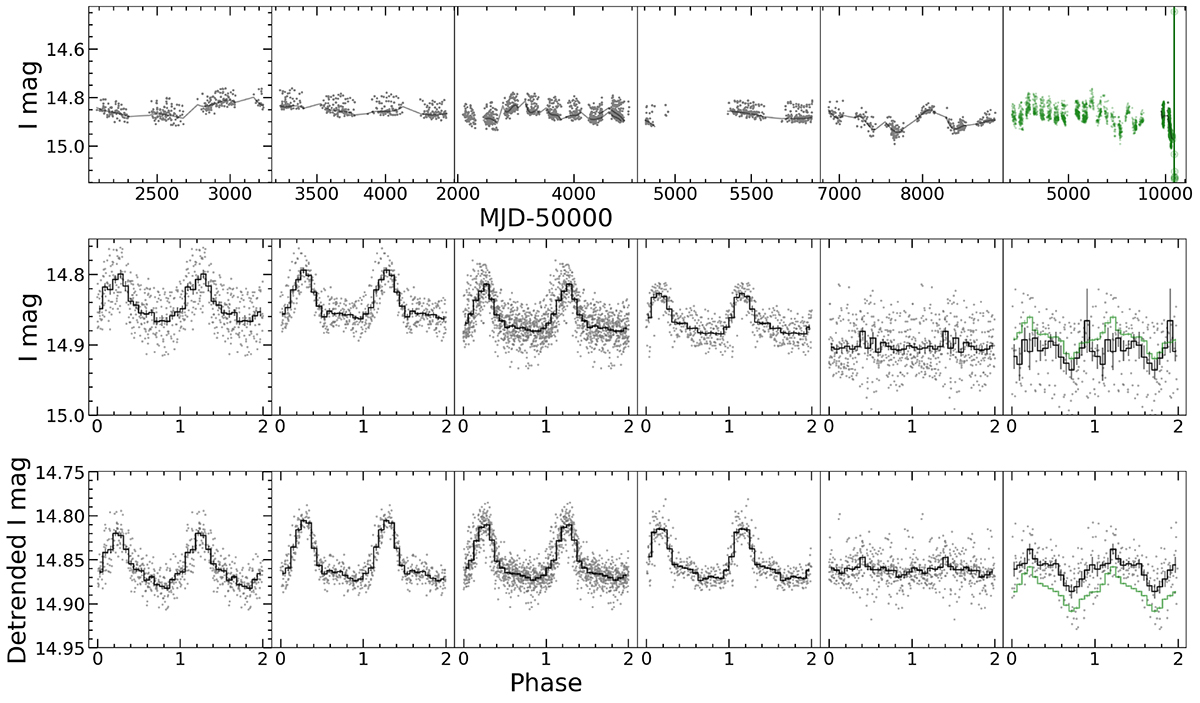
Light curve and evolving phase-folded profile of Source #84. We divided the light curve such that the first five pieces include approximately 300 points. The gray curve is the spline used for detrending the light curve. The phase-folded profiles use the original data in the middle row and the detrended data on the bottom. In green, we also plot the original high-cadence, unbinned data, with the final few points enlarged for emphasis. The vertical line marks the first observation of the May 2024 X-ray outburst (Yang et al. 2024). Although the period (17.55 days) for this source is in the confident category (Sect. 5.2), the signal seemingly disappears in the second to last piece of the light curve and then shows signs of reappearing more recently.
Current usage metrics show cumulative count of Article Views (full-text article views including HTML views, PDF and ePub downloads, according to the available data) and Abstracts Views on Vision4Press platform.
Data correspond to usage on the plateform after 2015. The current usage metrics is available 48-96 hours after online publication and is updated daily on week days.
Initial download of the metrics may take a while.