Fig. D.1
Download original image
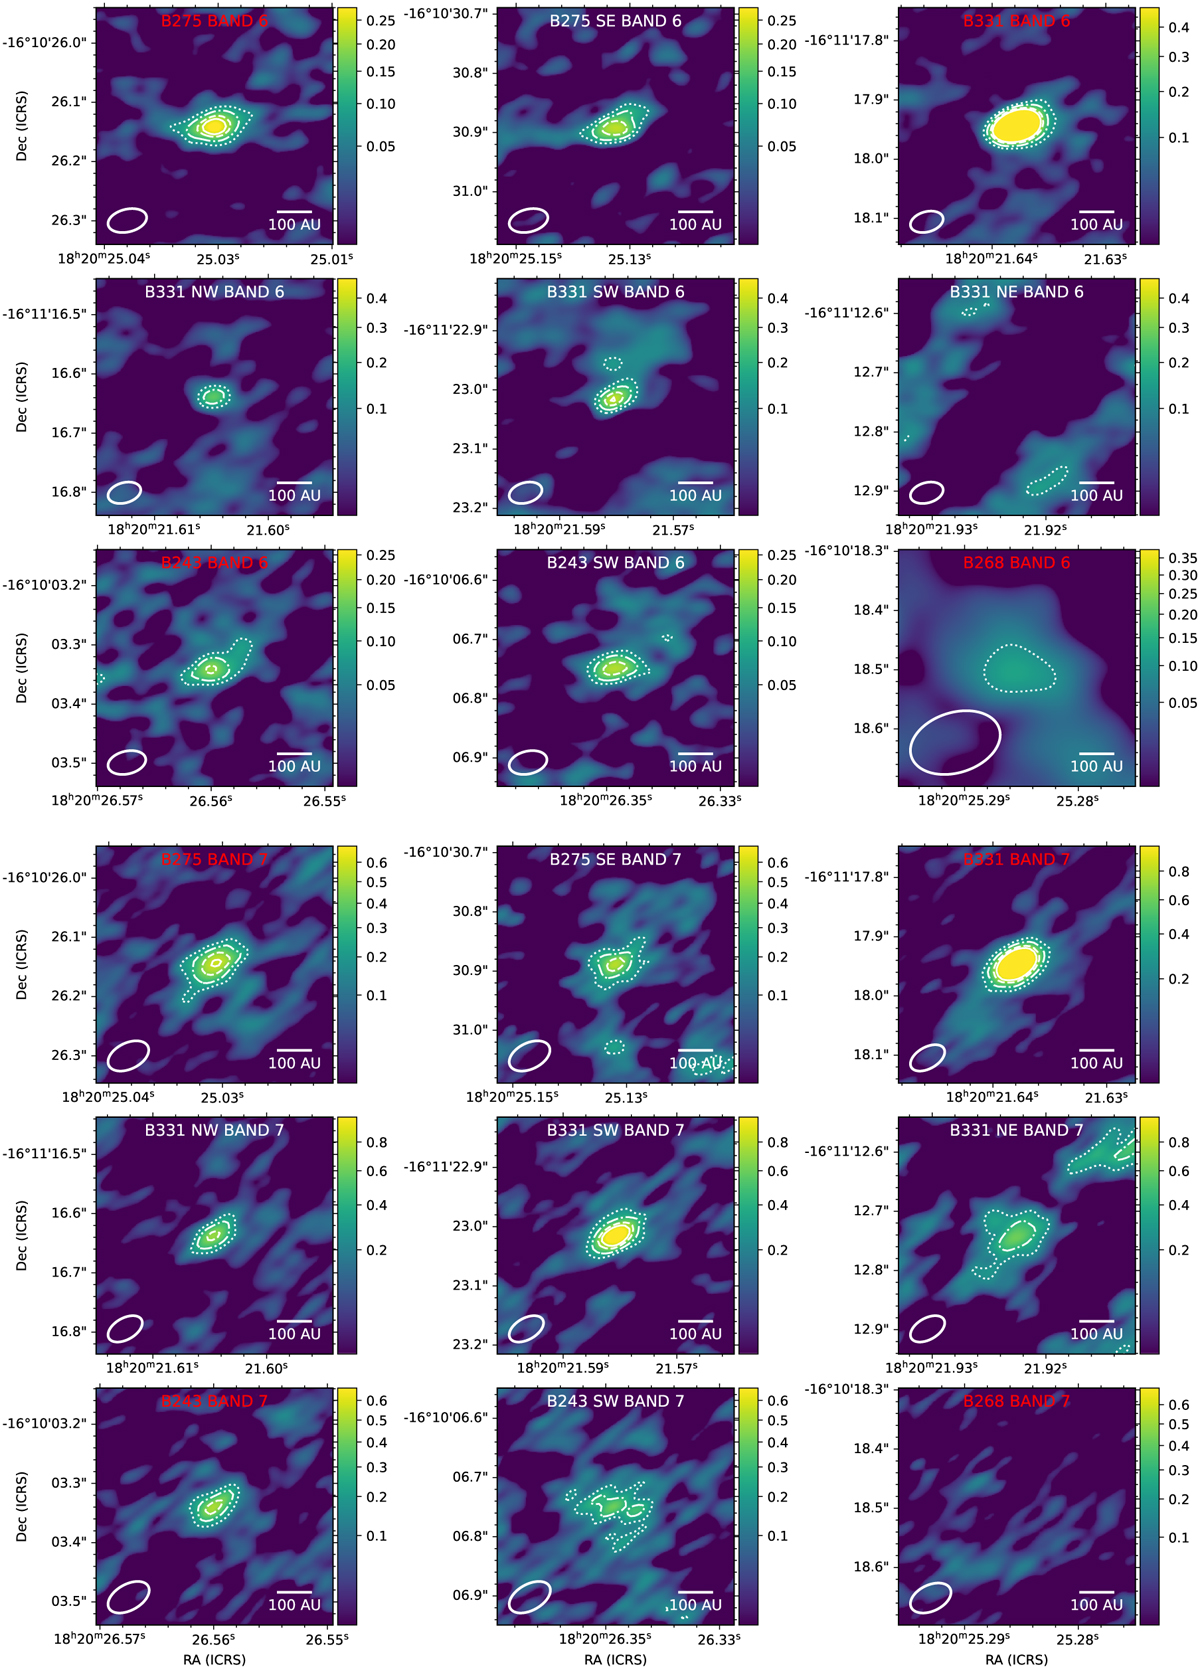
Zoomed-in images of all detected sources. The target sources are labeled in red; the serendipitous detections are labeled in white, and are named after the target in whose image they are detected (see Sect. 2.3). The flux scales of each image are slightly different. Contour levels: 3, 5, 8, 10 × noise rms (between 0.022 – 0.040 mJy in Band 6 and 0.056 – 0.083 mJy in Band 7). No radio continuum flux is detected for B268 in Band 7 and B331 NE in Band 6; they are included as illustrations.
Current usage metrics show cumulative count of Article Views (full-text article views including HTML views, PDF and ePub downloads, according to the available data) and Abstracts Views on Vision4Press platform.
Data correspond to usage on the plateform after 2015. The current usage metrics is available 48-96 hours after online publication and is updated daily on week days.
Initial download of the metrics may take a while.