Fig. 5
Download original image
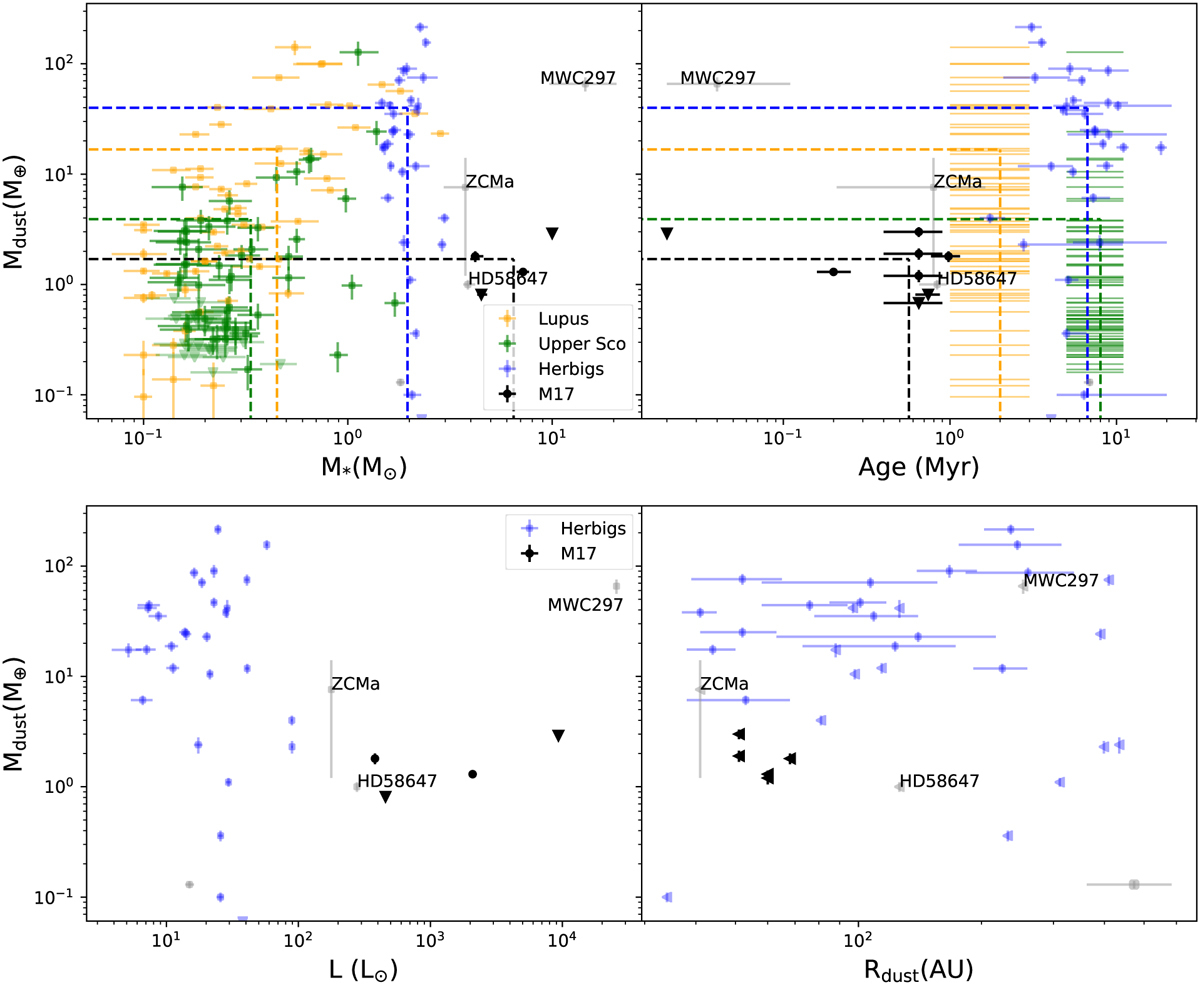
Disk dust mass as a function of stellar mass (upper left), age (upper right), stellar luminosity (lower left), and outer dust radius (lower right), based on ALMA continuum data for different samples. The low-mass PMS populations of the Lupus (Ansdell et al. 2016) and Upper Sco (Barenfeld et al. 2016) SFRs are shown in orange and green, respectively. For these populations the age range of the SFR is indicated by plotting each object as a horizontal line in the age plot. The Herbig Ae/Be sample from Stapper et al. (2022) is shown in blue and gray. The gray points are special cases in their sample that are both higher mass and younger; the labeled objects are discussed in the text. In black we show the PMS stars in M17 studied in this work. In the upper panels the mean dust mass, and the mean stellar mass (left) and age (right) of each sample are indicated with horizontal and vertical dashed lines. Upper limits on the dust mass are indicated by down-pointing triangles. Upper limits on the outer dust radius (lower right) are indicated by left-pointing triangles.
Current usage metrics show cumulative count of Article Views (full-text article views including HTML views, PDF and ePub downloads, according to the available data) and Abstracts Views on Vision4Press platform.
Data correspond to usage on the plateform after 2015. The current usage metrics is available 48-96 hours after online publication and is updated daily on week days.
Initial download of the metrics may take a while.